

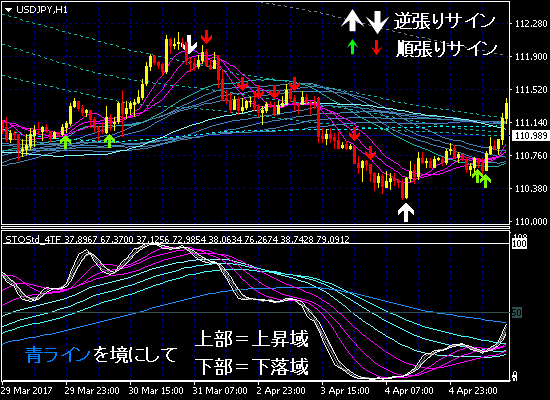
This is the entry and take-profit buy/sell signal!
▼This is the entry and take-profit signal
(USDJPY 1-hour)

<Simple trading rules>
・Enter on green/red signal after white signal!
(Or enter when green/red signal crosses above the blue Stochastic line)
・Take profit on an opposite white signal!
That’s all.
・Relation between arrow signals and the Stochastic lines
【Arrow Signals and Stochastic Lines】
(In the peak-bottom charts, more weight is given to the Stochastic, so the arrow signals are also based on the wave of the Stochastic. For explanation, the RCI part above is omitted.)
■Description of Arrow Signals
White arrow – a contrarian signal at the upper or lower bound area (ceiling or floor range)
(High likelihood of top or bottom)
Green・Red arrow – a trend-following signal outside the upper/lower bound areas (outside ceiling/floor ranges)
(Likely points for buying on dips during uptrends or selling on rallies during downtrends)
■ Structure and interpretation of the Stochastic lines
White - ultra-short-term line
Pink - short-term lines (3 lines)
Green - mid-term lines (3 lines)
Blue- long-term line
The Stochastic lines consist of white, pink (3 lines), green (3 lines), and blue lines.
As in the chart above
If all white/pink/green lines are above the blue line and rising to the right, it indicates a bullish trend
If all white/pink/green lines are below the blue line and falling to the right, it indicates a bearish trend
This is the basic principle.
Within the Stochastic’s upper and lower bounds (0–100 scale), each line repeats convergence and divergence
as the main behavior.
In general flow,
During an uptrend,① White approaches the upper bound,② White crosses below the pink,③ Pink crosses below green,④ All white/pink/green cross below blue
(At this stage, all lines are below blue), signaling a downtrend.
① White approaches the lower bound,② White crosses above pink,③ Pink crosses above green,④ All white/pink/green cross above blue
(At this stage, all lines are above blue), indicating an uptrend.
Of course, during this period, the short-term lines move in a complex way, but ultimately, due to the properties of the Stochastic lines,
they will inevitably repeat this kind of convergence and divergence.
Therefore, when all lines form a clean shape and slope upward to the right, it clearly indicates an uptrend,
and when all lines form a clean shape and slope downward to the right, it clearly indicates a downtrend.
Based on this concept, during an uptrend, at points judged as pullbacks, only green arrow signals light up (upward),and during a downtrend, at points judged as rallies, only red arrow signals light up (downward).・Stochastic lines as a tool for determining tops and bottomsA peak-bottom chart, as its name suggests, is fundamentally a chart for capturing tops and bottoms.Therefore, we will explain what shapes of the Stochastic lines can serve as a criterion for determining tops and bottoms (≒ white arrow signals) by presenting several patterns (concrete examples).Pattern 1-Only the white line touches the upper (lower) bound or nearly touches it.In this case, only when white and all three pink lines deviate significantly from the other mid/long-term lines.White arrow signals often do not light up.Also, after the white line touches the upper/lower bound, it often reverses strongly.Pattern 2-At the upper bound (lower bound), the white line crosses the pink.Various contact points: first pink line, first/second pink line crossing, pink 1–3 line crosses, etc.Pattern 3-In a major uptrend or downtrend, at the upper (lower) bound, the three pink lines cluster and touch (cross) with green.『Heavenly Bottom Chart MT4 – Full Version』(32,800 yen)
and during a downtrend, at points judged as rallies, only red arrow signals light up (downward).
・Stochastic lines as a tool for determining tops and bottoms
A peak-bottom chart, as its name suggests, is fundamentally a chart for capturing tops and bottoms.
Therefore, we will explain what shapes of the Stochastic lines can serve as a criterion for determining tops and bottoms (≒ white arrow signals) by presenting several patterns (concrete examples).
Pattern 1 -Only the white line touches the upper (lower) bound or nearly touches it.
In this case, only when white and all three pink lines deviate significantly from the other mid/long-term lines.
White arrow signals often do not light up.
Also, after the white line touches the upper/lower bound, it often reverses strongly.

Pattern 2-At the upper bound (lower bound), the white line crosses the pink.
Various contact points: first pink line, first/second pink line crossing, pink 1–3 line crosses, etc.

Pattern 3 -In a major uptrend or downtrend, at the upper (lower) bound, the three pink lines cluster and touch (cross) with green.


