

"Nikkei Stock Average After the Bubble Burst" seen in the 天底チャート MT4 – the highest closing price after the bubble burst
On November 9, the Nikkei Stock Average rose to its highest level since the bubble burst, reaching its highest since January 1992,
and has been moving in a high price range for the first time in about 26 years.
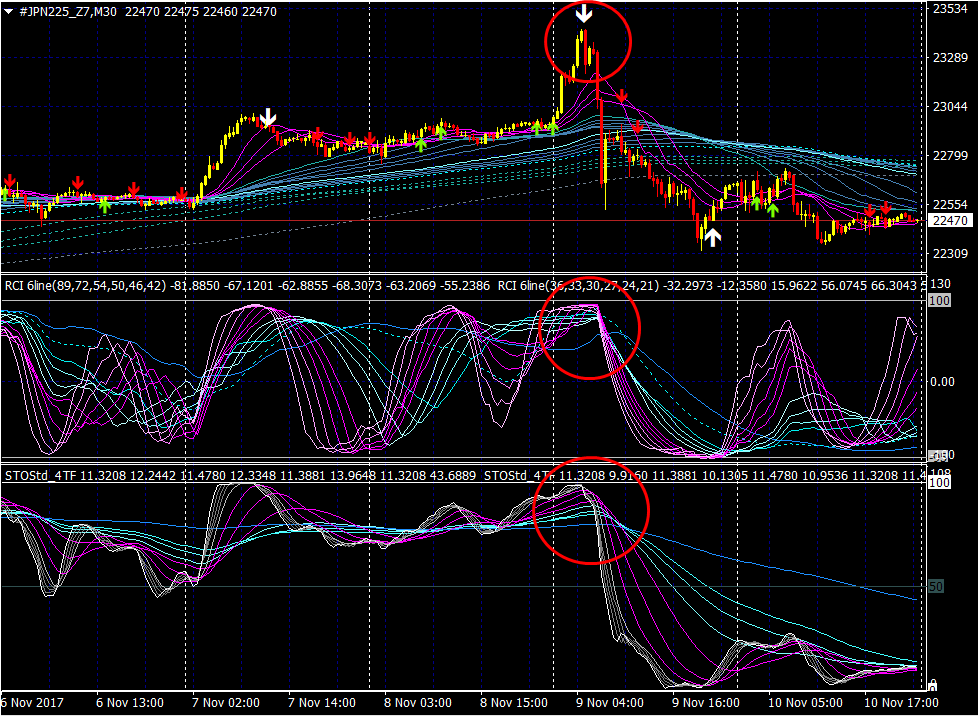
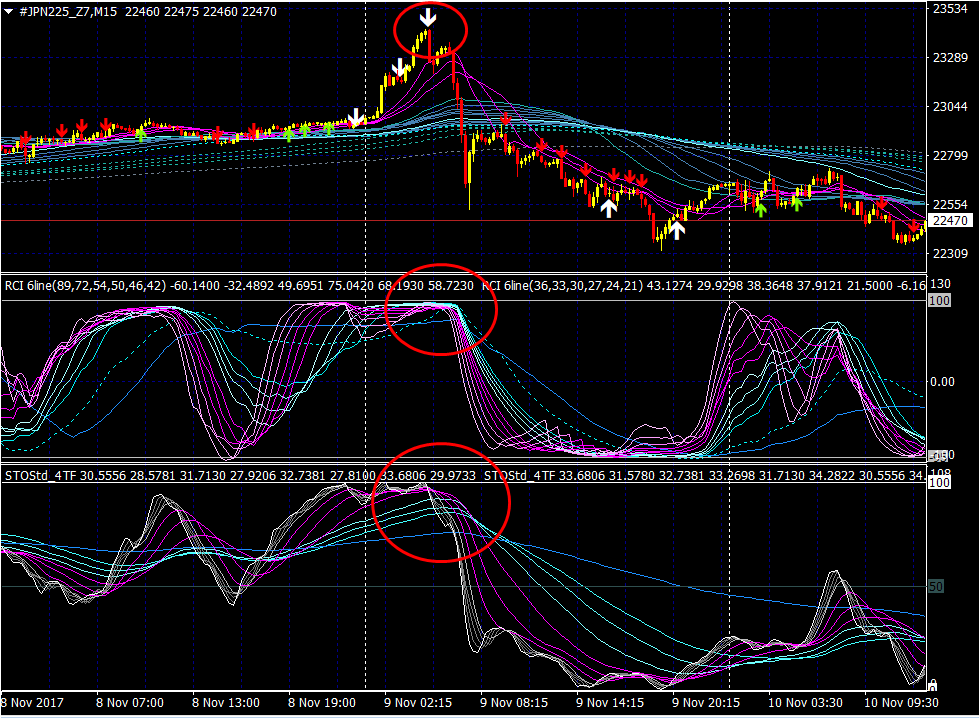
These are the intraday charts in the ceiling zone for the 9th.
Apart from the 1-hour chart, at each level there are white signals indicating a ceiling.
Nikkei 225 (Japan225 CFD) Daily Chart

Nikkei 225 (Japan225 CFD) 1-Hour Chart

Nikkei 225 (Japan225 CFD) 30-Minute Chart
Nikkei 225 (Japan225 CFD) 15-Minute Chart
Nikkei 225 (Japan225 CFD) 5-Minute Chart


× ![]()


