

HL Break Plus, HL Break+ M15 Forward Test (Demo Trade Operation) Results Analysis
「HL Break+ M15」「HL Break Plus」 we conducted the forward test (trading on a demo account) and analyzed the results.
The current profit graphs look like the following for each.


<< As of 21/07/04 >>
From the trading history as of 21/07/04, the breakdown of profits by currency pair was as follows.
Overall it’s not going very well, but both show a favorable trend for GBP/JPY.
As of 21/07/04:
<HL Break Plus>
<HL Break+ M15>
This is my personal analysis.
(This is “BB break M15” analysis, which is almost the same.)
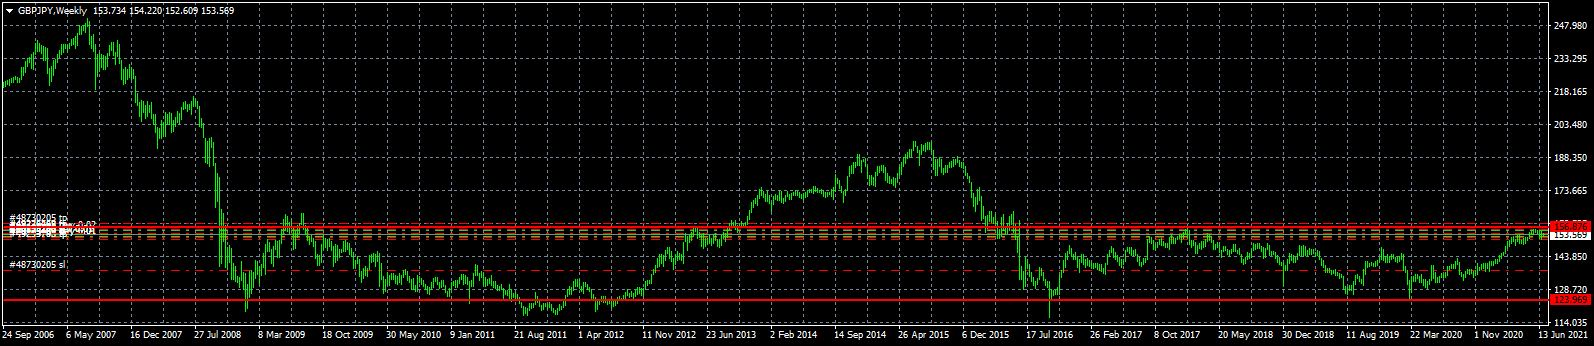
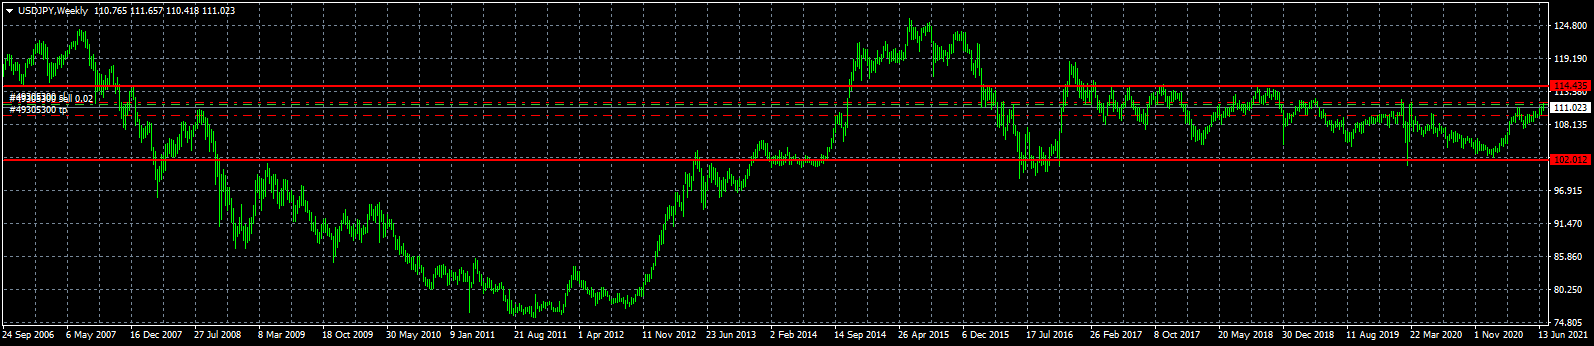
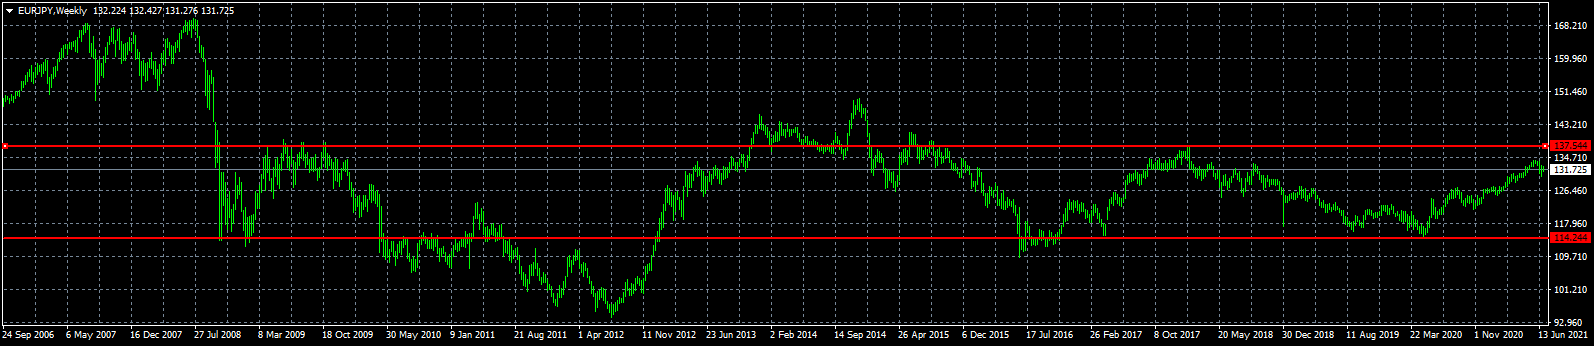
Below I have arranged weekly charts over the long term, and for about the last five years the price range has become considerably narrower than before (no clear trend, moving up and down within a constant price range).
This EA I created is basically a trend-following type (following the direction the market tries to move), so it isn’t good at markets that don’t move much.
If the market goes up (or down) and then returns (there isn’t enough momentum to break out of stagnation, returning below the high and above the low), it tends to lead to less favorable results (there is a divergence from backtests), which is my analysis.
As for GBP/JPY, although there isn’t a clear trend compared with the past,
compared with other currency pairs, its price range is wider and moves more easily, so in the short-to-medium term there is a trend and I think it’s yielding good results.
From the charts below, USD/JPY and EUR/JPY show ranges of about 10–20 yen, while GBP/JPY shows about 20–30 yen of movement range.
I would like to improve this area further in the future.
[GBPJPY]
[USDJPY]
[EURJPY]


 」「
」「 」 we conducted the forward test (trading on a demo account) and analyzed the results.
The current profit graphs look like the following for each.
<< As of 21/07/04 >>
From the trading history as of 21/07/04, the breakdown of profits by currency pair was as follows.
Overall it’s not going very well, but both show a favorable trend for GBP/JPY.
As of 21/07/04:
<HL Break Plus>
| EUR/USD | AUD/JPY | USD/JPY | EUR/JPY | GBP/JPY | |
|---|---|---|---|---|---|
| 2021 | -5191 | -22420 | 0 | 41720 | 32630 |
| 2020 | -3384 | -16070 | -21700 | 10310 | 8800 |
<HL Break+ M15>
 >
>| EUR/USD | AUD/JPY | USD/JPY | EUR/JPY | GBP/JPY | |
|---|---|---|---|---|---|
| 2021 | 0 | -54690 | 0 | -19770 | 68190 |
| 2020 | -20646 | -8740 | -8570 | -40640 | 39240 |
This is my personal analysis.
(This is “BB break M15” analysis, which is almost the same.)
Below I have arranged weekly charts over the long term, and for about the last five years the price range has become considerably narrower than before (no clear trend, moving up and down within a constant price range).
This EA I created is basically a trend-following type (following the direction the market tries to move), so it isn’t good at markets that don’t move much.
If the market goes up (or down) and then returns (there isn’t enough momentum to break out of stagnation, returning below the high and above the low), it tends to lead to less favorable results (there is a divergence from backtests), which is my analysis.
As for GBP/JPY, although there isn’t a clear trend compared with the past,
compared with other currency pairs, its price range is wider and moves more easily, so in the short-to-medium term there is a trend and I think it’s yielding good results.
From the charts below, USD/JPY and EUR/JPY show ranges of about 10–20 yen, while GBP/JPY shows about 20–30 yen of movement range.
I would like to improve this area further in the future.
[GBPJPY]
[USDJPY]
[EURJPY]
Therefore, since GBP/JPY is performing well, I focused this EA on GBP/JPY, and proceeded with customization and improvements.
The EA I created is
HL band H4 for GJ”
Pound-USD (HL band M15 for GJ)”
After improvements, I also incorporated elements of “HL band M15” to increase profitability.
Forward testing has also been conducted for this as well.
The results are positive but still feel like they’re just getting started (laugh).
 ”
”
 ”
”
 ” to increase profitability.