

Utilization of the “Visualization Indicator” (Part 16)
Use of the "Visualization Indicator" (Part16)
"8CFD Visualization Indicator" to monitor the trends of commodities(COTTON, COFFEE, SUGAR, COCOA, CORN, SBEAN) over about one month (from10月日~11月日). During this period, COCOA declined the most. Since COCOA was already in a downtrend, holding a short position would be profitable.
With the "8CFD Visualization Indicator", you can see at a glance where to enter sell and where to close.
The figure below shows the "8CFD Visualization Indicator" displayed on a 1hour chart. The upper half is the COCOA chart, and the lower half is a chart drawn with the "8CFD Visualization Indicator". The green bold line graph corresponds to COCOA.
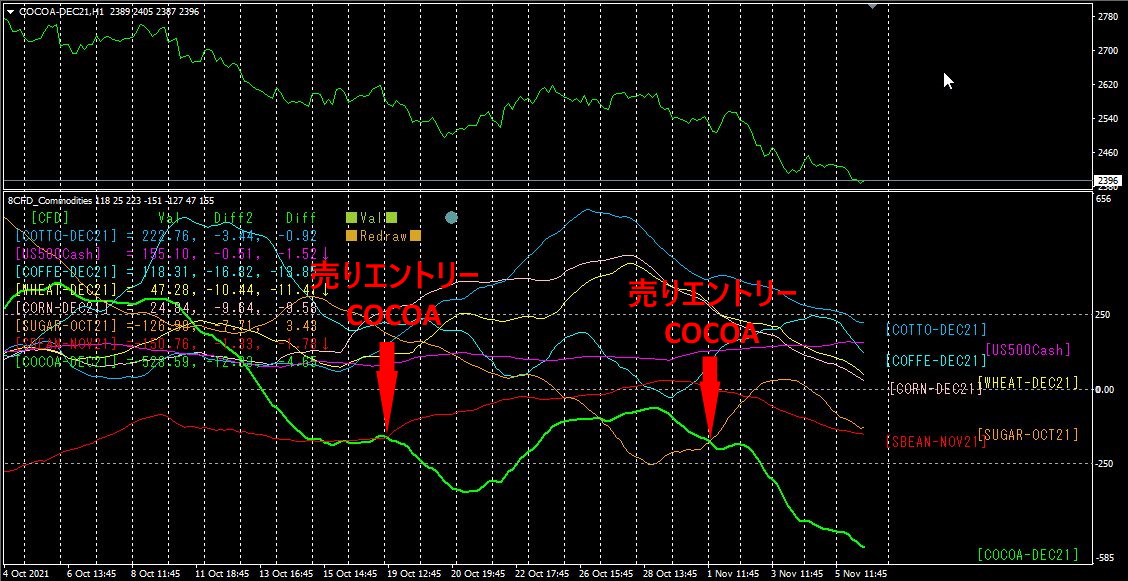
The red downward arrows are sell entry points. From the first arrow, 105Points, and from the second arrow, 127Points, were earned, totaling 232Points of profit. If a trade of 1Lots had been made, this would amount to 232$ profit (at1$=113, 26,216).
1hour chart was examined in more detail.
3The moving averages in the book are SMA20,75,200.
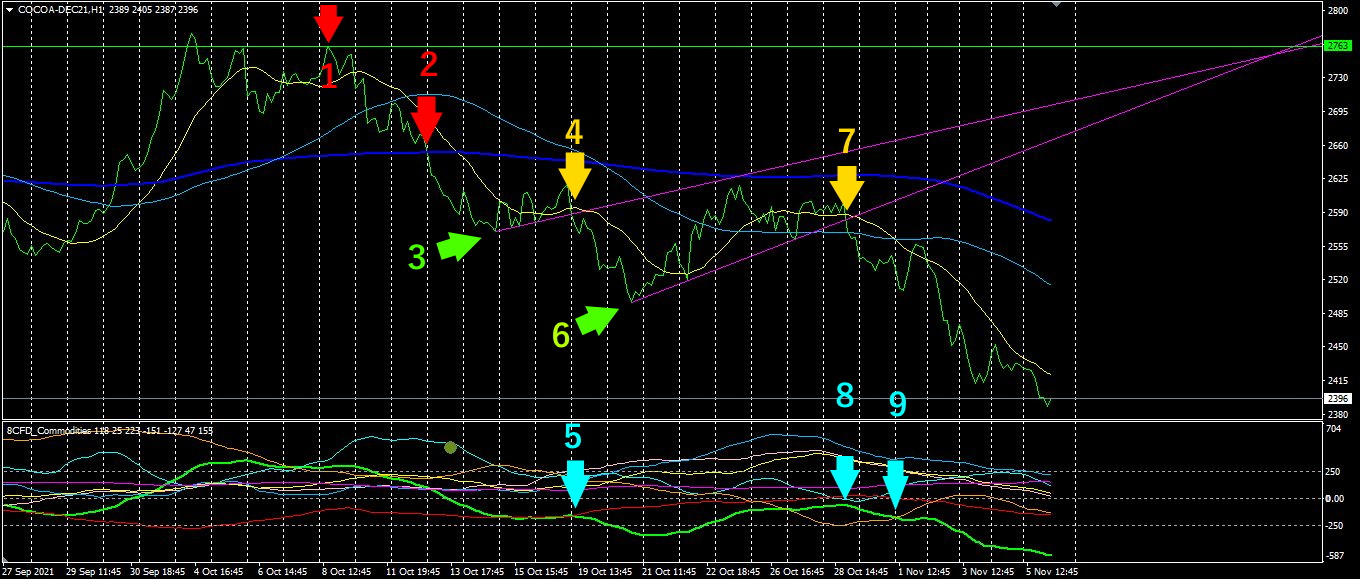
Red Arrow 1 has not updated the recent high. The uptrend ended, so we will view the chart with a bearish bias from here on.
Red Arrow 2 fell below the moving average (200SMA). The rate will fall further.
Green Arrow 3 during the decline, a brief rebound occurs. From the position of green arrow 3, draw a counter-trend line.
Yellow Arrow 4 having broken the counter-trend line drawn at 3, we enter a sell here. [Pullback sell]
Light blue Arrow 5 From the "Visualization Indicator" as well, the horizontal line has turned downward. The graph groups in the book show COCOA breaking downward.8 The graph lowers as COCOA drops.
Green Arrow 6 Take profit on the position sold at arrow 4. (2 → 3 down by 4 → 6, the indicator graph becomes flat)
As the rate rises again, we redraw the counter-trend line.
Yellow Arrow 7 having broken the counter-trend line drawn at 6, we enter another sell here. [Second pullback sell]
Light blue Arrow 8 The chart reverses on the "Visualization Indicator" and heads downward.
Light blue Arrow 9 On the "Visualization Indicator", the graph groups for COCOA once again break downward.
At this point, you could add further positions.
Undrawn Arrow 10 not yet drawn, but if the graph of the Visualization Indicator turns upward, we will close the position there.
The chart is still showing a downtrend. The graph of the Visualization Indicator is also downward.
Therefore, it is still reasonable to hold short positions. As a target for closing, you could use the most recent lows of the daily moving averages (2330) and similar levels.
combined with the "Visualization Indicator" is, in my view, the strongest combination.


