

Harmonic Pattern Detection Indicator V10 Utilization: Capture the Double Top!
For Harmonic Pattern Detection Indicator V10, click here
There is also a monthly subscription version available with a free first month, so if you want to try it, please use this.
Harmonic Pattern Detection Indicator V10 Subscription Edition
It also retains powerful waveform exploration features, and users are surely aware that it is not merely a match by zigzag.
This time, we would like to challenge detection of double tops and double bottoms.
Previous article: “Capture the Wolfe Wave!”
Please refer to the previous article for preparation, etc.
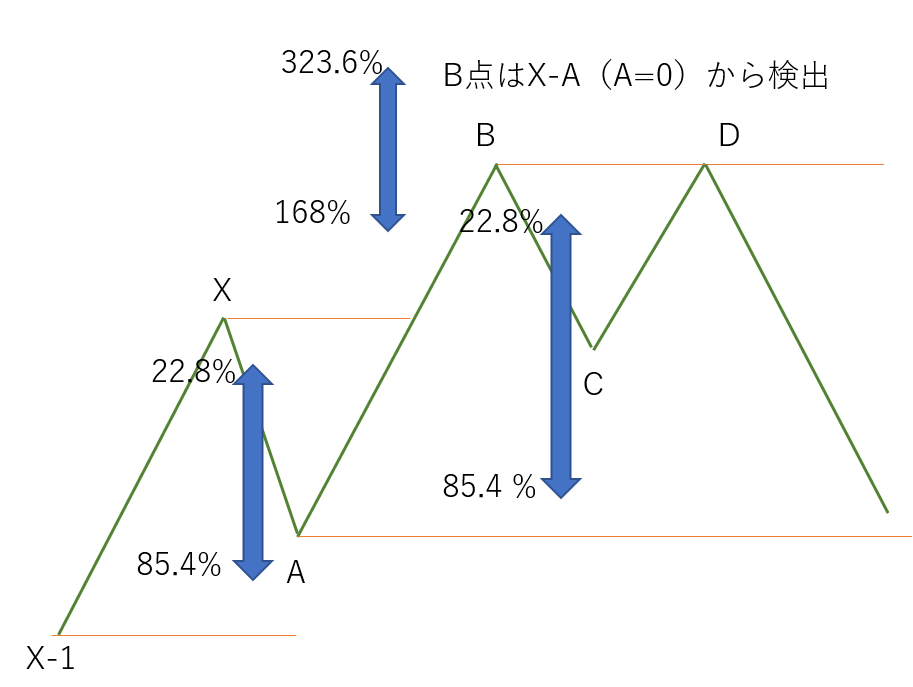
This time as well I drew one diagram to consider double tops. For double tops/double bottoms, when the price reaches point D that coincides with point B in an uptrend, detection is performed. For now, I’ve set the B point position a bit higher than in the previous Wolfe wave.
Well then, let’s start writing into the CSV.
Like this.

Since I decided to compute point D from AB, I set DType to 3 and TDType to 1.
Since the target is at the same position as point B, the minimum and maximum for D are ±5%. By setting TD1 to 1 and reaching point B, the shape will be drawn. Let’s display it now.
USD 1H
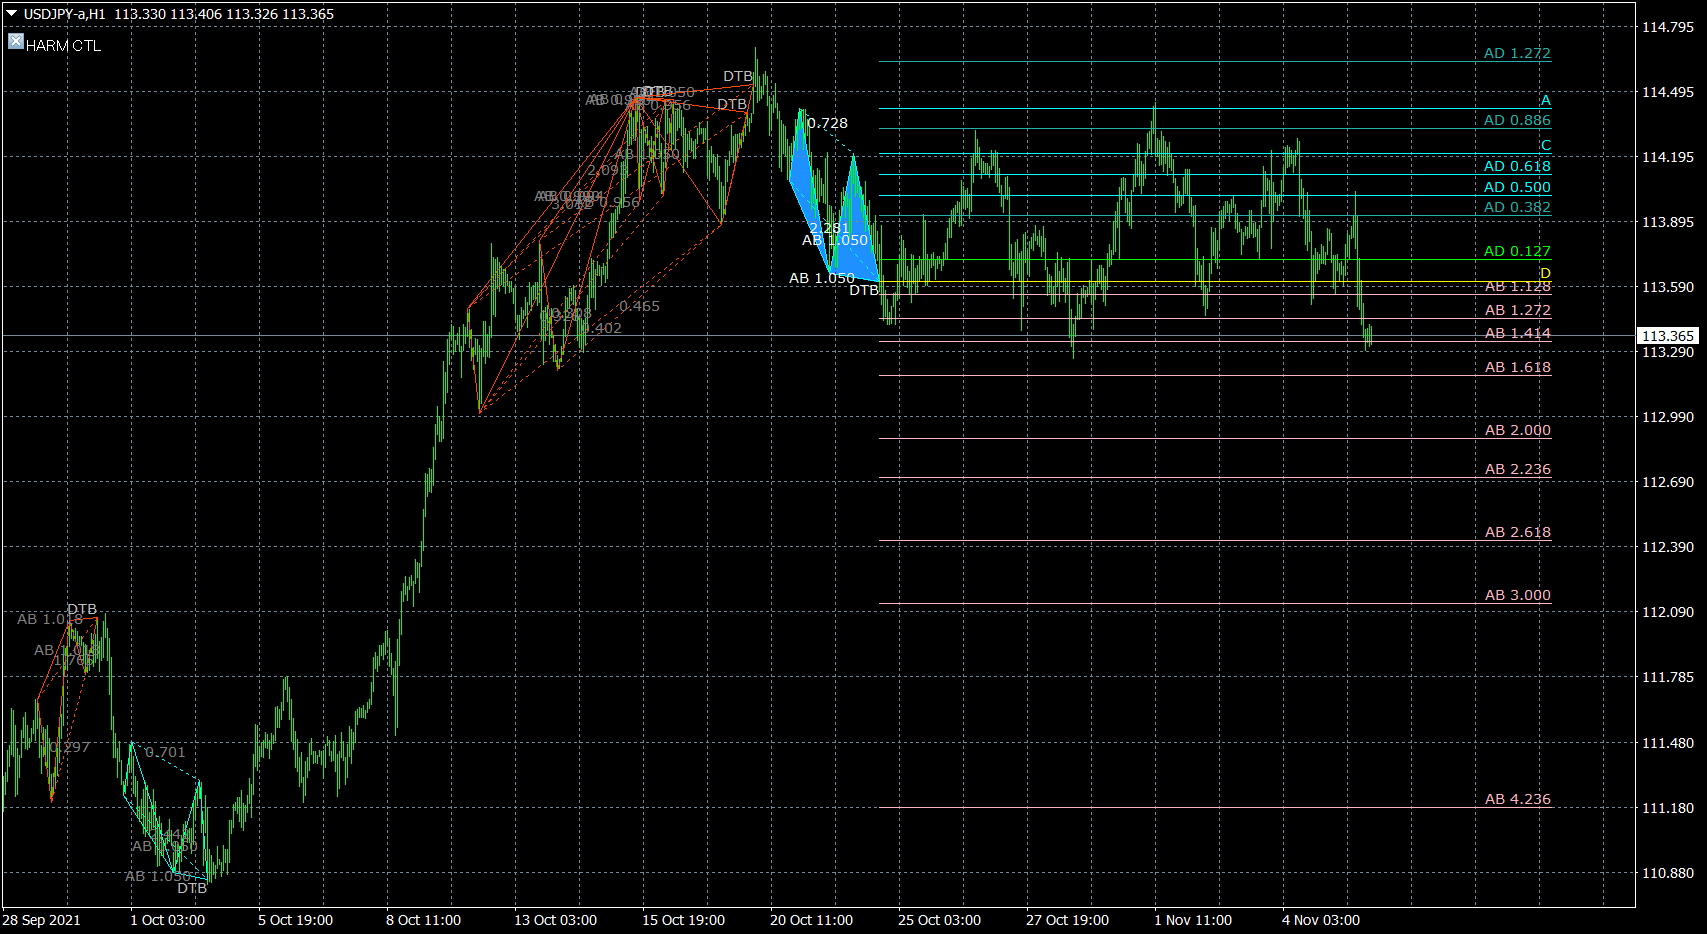
...It appears in a fairly good place.
Within the visible screen range there are slight pushes sometimes, but the win rate is 100%. Amazing (laugh).
Since we condition A to be higher than X-1, it does not appear at simple V-shaped spots. Conversely, this seems to work well as a filter, but for now let’s remove the condition.

Registered as TD2.
Changed the minimum and maximum of point A to 0.
Let’s close Excel and display it in the indicator right away.
※ The indicator fails to display if Excel is not closed.
The result looks like this.
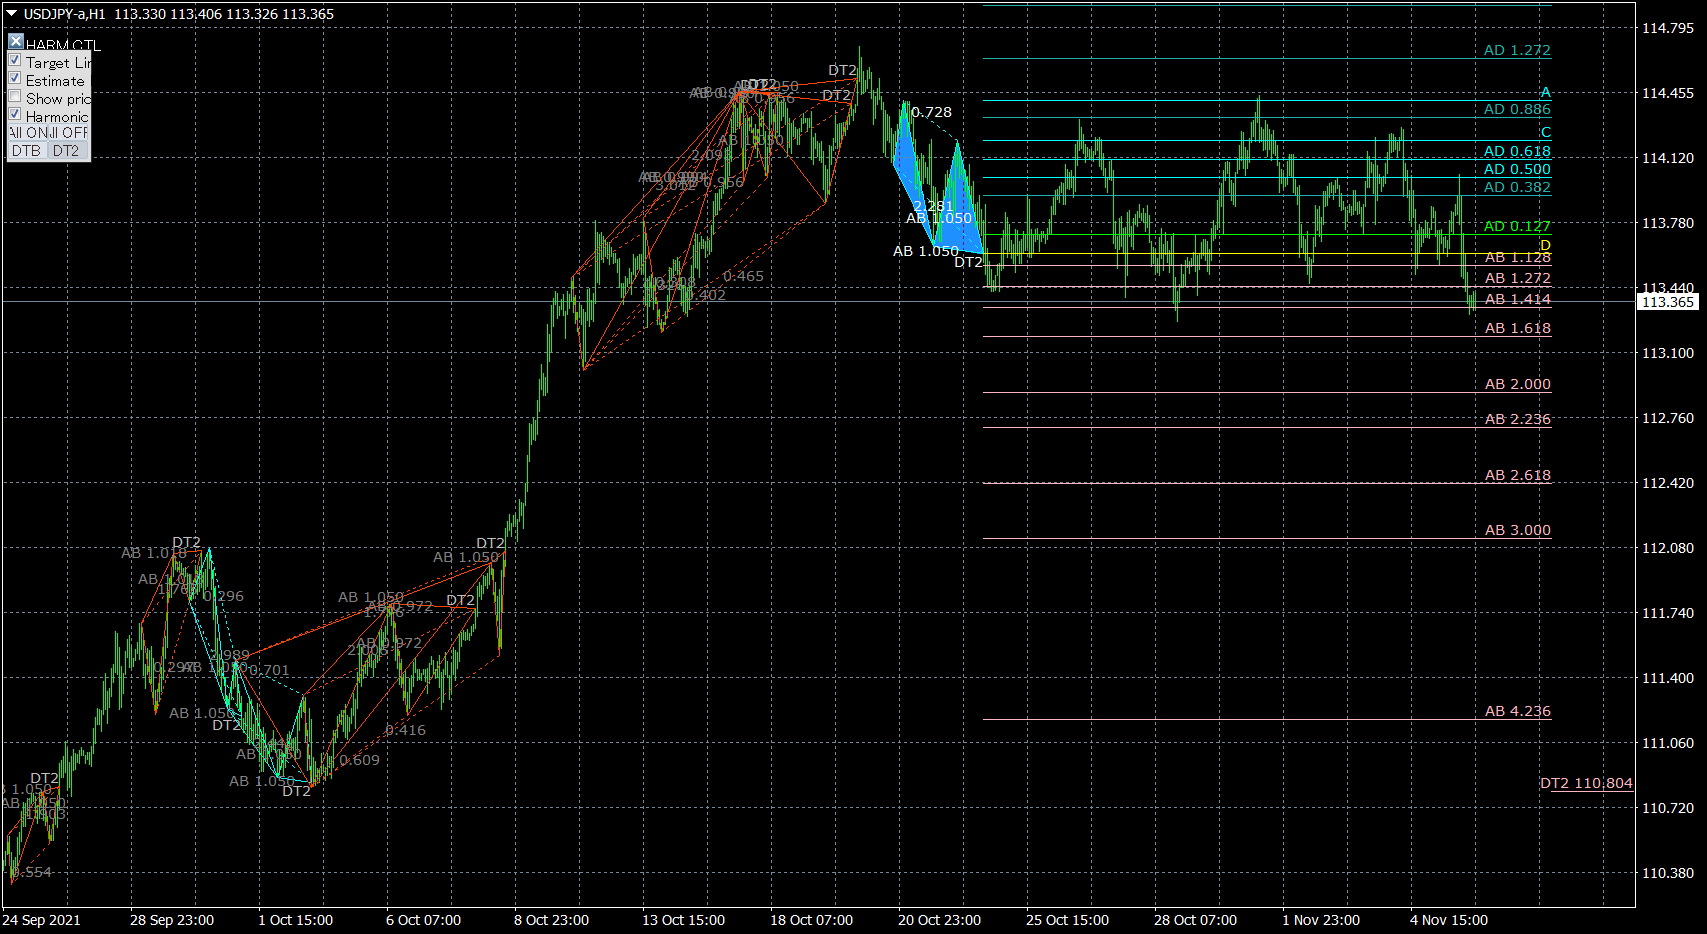
The number of detections is detected just before the dollar-yen sharp rise in the lower left, but all of them are off. Considering reliability, keeping the condition X-1 < A seems better.
Also, when reviewing past charts, overly small waveforms are detected repeatedly. When actually using it, it would be better to reconfigure the ATR filter.
Now, with the USD/JPY, the recent range-bound period’s double-top-looking instance has not been detected. This seems due to the condition A < C.
Considering this, it seems possible to detect head-and-shoulders shapes as well.
So, next time I’d like to consider detecting head-and-shoulders.