
The chart is fractal
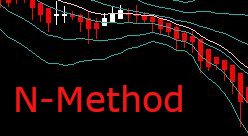
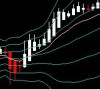
I will place two USD/JPY charts.


Which timeframes are they respectively?
You probably can’t tell.
The correct answer is that the first is a 4-hour chart and the second is a 5-minute chart.
There isn’t something like a fingerprint for each timeframe on the charts.
As you can see, the charts exhibit a fractal structure.
Therefore, by looking at the 4-hour chart, you can learn about the 5-minute or daily charts.
Also, the same chart will never appear twice in the first place.
Past verification is important, but pattern recognition alone won’t unlock the future.
But precisely because the future isn’t visible, miracles that couldn’t be predicted from past experience may occur in the future.
If the past repeats endlessly, isn’t that despair?
N-Method is here.