

Usage of the "Visualization Indicator" (Part 15)
Utilization of the "Visualization Indicator" (its15)
"8CPVisualization Indicator"for,24currency pairs over approximately2months (9months9days〜10months29days) were tested.
This is a somewhat long-term test for the first time. It might be hindsight, but ifGBPJPY,CADJPY,AUDJPYhad been boughta total of1,560PIPSprofitcould have been obtained.
Three instances of the "Visualization Indicator" (Oceaniaversion,, Londonversion,, NewYorkversion) are displayed on the same chart (1hour) timeframe.1hour) timeframe.
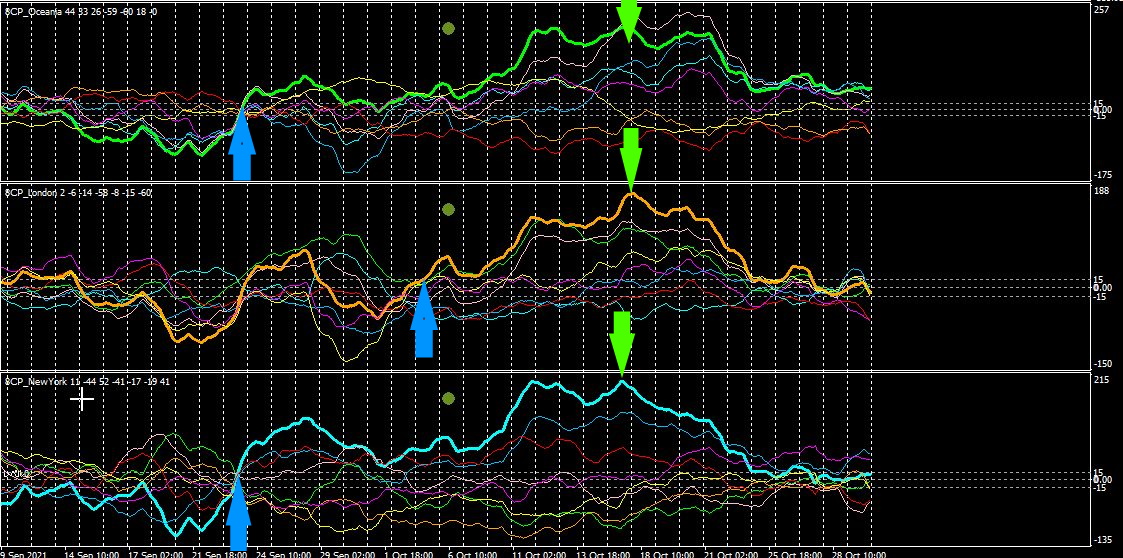
From the top, the "Visualization Indicator" versions are Oceania,Londonversion,NewYorkversion.
The green thick-line graph corresponds toAUDJPY, the orange thick-line graph toGBPJPYCADJPY.
An upward light-blue arrow marks the buy entry point. A downward green arrow marks the exit point.
Here are the results.
Currency pair Entry date Exit date Profit
AUDJPY 9month23day10月15430PIPS
GBPJPY 10month4day10month1515580PIPS
CADJPY 9month23day10month15day550PIPS
The basic procedure of the "Visualization Indicator" isas follows:
(1)Wait for convergence
(2)Enter on currency pairs that break out of the chart groups
(3)Enter in the direction of the breakout
That's all.


