Visualize buy/sell outlook with Dow Theory!『VisualizeDow』
Do you have these concerns?
・I don't know where to set the swing highs and swing lows.
・MT4's standard ZigZag repaints (redraws) and is not reliable.
・When I buy, it goes down; when I sell, it goes up, leaving me zigzagging.
This indicator is recommended for those who fit the following
・I don't know where to set the swing highs and swing lows.
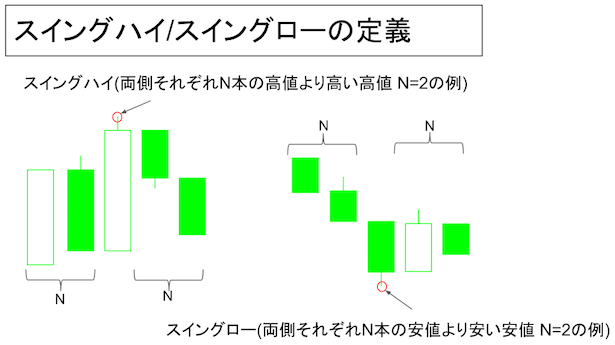
-->Draws waves on the chart based on the widely used swing high (highs) / swing low (lows) definitions.
・MT4's standard ZigZag repaints (redraws) and is not reliable.
-->Because it draws lines using confirmed candles, once drawn the lines will not be changed.
・When I buy, it goes down; when I sell, it goes up, leaving me zigzagging.
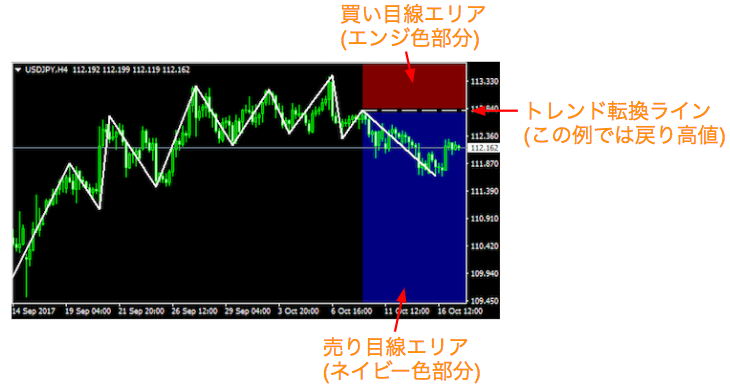
-->Draw a baseline at pullback lows and retracement highs that tend to be trend reversal points, and color the buy bias and sell bias areas to visualize the bias.
【Functions】
・Draws lines on the chart for highs and lows in accordance with the swing high/swing low definitions.
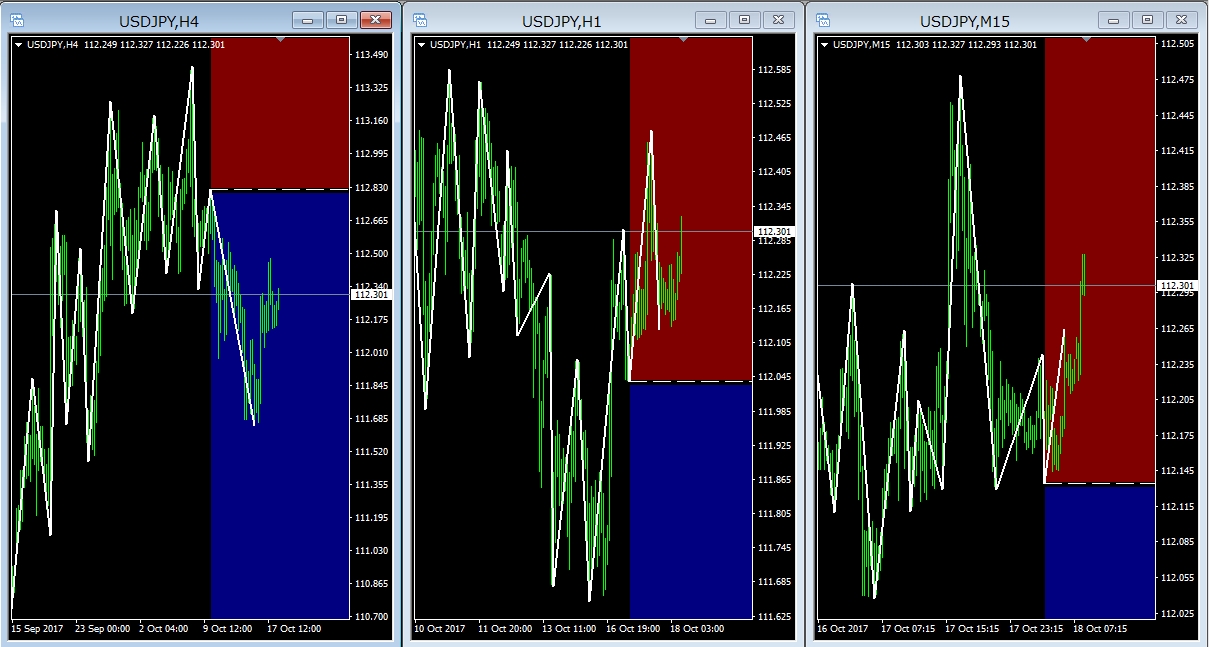
・Draws a line at the last pullback low or retracement high, and colors the area above as the buy bias and below as the sell bias to clearly show which bias is active and visualize where a trend reversal would occur if price breaks through.
■ View on multiple timeframes