Simulation example of the movement of the天底チャート ... [天底チャートの基礎(5)-全8]
Simulation example of the Movement of the Market Bottom Chart
As one example, let us look at the actual flow from the bottom to the top.
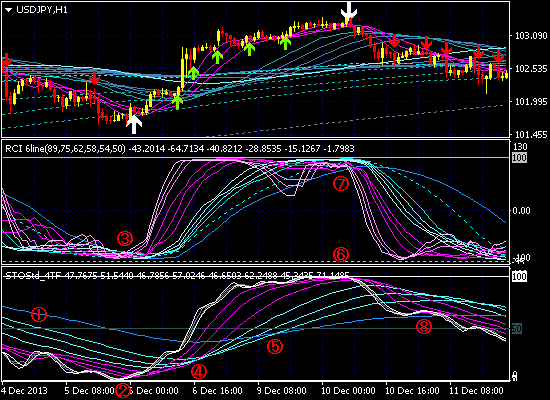
① All lines are below blue, in a continuing downtrend state.
② At the lower limit, white touches pink, forming a bottom (white arrow lights up).
③ At the same time, RCI also has all lines densely packed at the lower limit.
④ White surpasses the three pink lines, pink touches green, and additionally the three pink lines surpass the green, turning upward.
⑤ All lines surpass blue, in an uptrend.
⑥ At the upper limit, white touches the three pink lines, forming a top (white arrow lights up).
⑦ At the same time, RCI also has all lines densely packed at the upper limit.
⑧ White falls below the three pink lines, pink touches green, and additionally the three pink lines fall below the green, turning downward.
Next time, to [Basics of the Market Bottom Chart ⑥], continues.
┏━┓
┃★┃ Video viewing of 'Market Bottom Chart MT4'
┗━┻━━━━━━━━━━━━━━━
Where do signals appear?
→ I tried trading with backtesting.