

Basic logic of buy/sell signals … [Foundation of top/bottom charts (2) - 8 of 8]
Basic explanation of the arrow signs and the Stochastic line
【Arrow signs and the Stochastic line】
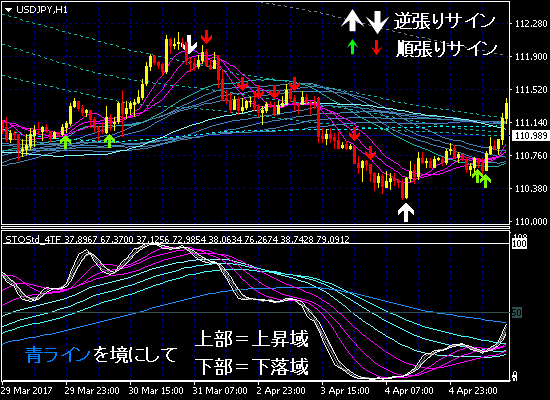
In (the) top-bottom chart, the Stochastic is given more weight, so the arrow signs are also
based on the Stochastic waves. For explanation, the RCI part is omitted from the above diagram.)
■Description of the arrow signs
White arrow – a contrarian sign at the upper and lower bounds (ceiling and floor zones)
(High probability of reaching the ceiling or floor)
Green・Red arrows – a trend-following sign outside the upper and lower bound zones (outside ceiling/floor zones)sign
(Possible buy-on-dip at rises and sell-on-rebound during declines)
■ Structure and interpretation of the Stochastic lines
White - ultra-short-term line
Pink - Short-term line (three lines)
Green - Mid-term line (three lines)
Blue- Long-term line
The Stochastic lines consist of four colors: white, pink (three lines), green (three lines), and blue.
As in the chart on the previous page,
All three white pink and green lines above the blue line and sloping upward indicate a rising market
All three white pink and green lines below the blue line and sloping downward indicate a falling market
is the basic rule.
Within the Stochastic upper and lower bounds (0–100 scale), each line alternates betweenconvergence and divergence.
The basic flow is,
In an uptrend,① White reaches the upper bound,② White crosses below pink,③ Pink crosses below green,④ All three white-pink-green cross below blue
(At this stage, all lines are below blue), entering a downtrend.
① White reaches the lower bound,② White crosses above pink,③ Pink crosses above green,④ All three white-pink-green cross above blue
(At this stage, all lines are above blue)
, entering an uptrend.Of course, during this interval the short-term lines may move complexly, but ultimately, due to the properties of Stochastic lines,
they must repeatedly exhibit this pattern ofconvergence and divergence.
Therefore, when all lines form a clean shape and trend upward to the right, it clearly indicates an uptrend,
and when all lines form a clean shape and trend downward to the right, it clearly indicates a downtrend.
Based on this approach, during the upward trend, a green arrow sign lights up at a point considered to be a pullback, and during the downward trend, a red arrow sign lights up at a point considered to be a rebound.
In the next part, [Foundations of the Up-Down Chart ③] will continue.
┏━┓
┃★┃ Viewing 'Foundations of the Up-Down Chart MT4' in video
┗━┻━━━━━━━━━━━━━━━
Where do the signs appear?
→ I tried trading with backtesting.


‘Foundations of the Up-Down Chart MT4’


