
GDP and Stock Market Value: Are Japanese Stocks Overvalued? (2)
Hello, this is Nikkei OP Salesman, the administrator.
Thank you very much for visiting this blog.
We would like to provide information that is helpful to everyone, so please support us.
Now, the theme this time isGDP and Equity Market Capitalization (2).
Yesterday, I mentioned that the numbers Warren Buffett is paying attention to include GDP and the market capitalization of the stock market.
What percentage of GDP does the stock market capitalization represent?
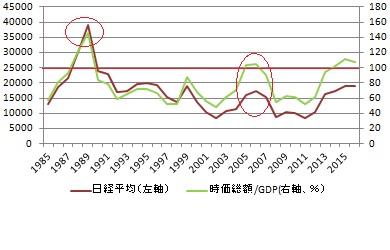
Today, I have added the movement of the Nikkei average to the chart from yesterday.
The chart below (top) shows the following numbers since 1985.
☆ Red: GDP (trillion yen, left axis)
☆ Blue: Market capitalization (trillion yen, left axis)
☆ Green: Market capitalization ÷ GDP (%, right axis)
The chart (bottom) shows,
☆ Green: Market capitalization ÷ GDP (%, right axis)
☆ Brown: Nikkei average (yen, left axis)
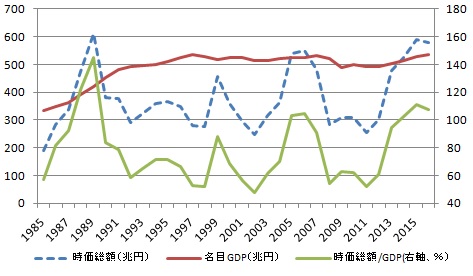
Source) Japan Exchange Group, IMF
The movement of the Nikkei average and the GDP/market capitalization correlation is quite high, isn’t it?
And in the parts circled in red, namely when stocks were overvalued relative to the real economy (nominal GDP), they both had to undergo adjustments twice.
The data points are limited, but I believe this is a relationship that cannot be ignored.
By the way, as of April, IMF's forecast for Japan's nominal GDP at the end of 2017 is 546 trillion yen.
On the other hand, as of the end of August 2017, including emerging markets, Japan's stock market capitalization is 620 trillion yen.
This means the GDP ratio is 113.7%.
In Japan, where GDP does not grow much, it can be said that the stock market is quite overvalued. Relying solely on the PER to determine over/under valuation may be dangerous.
Note) The above is my personal view, and is intended solely to improve financial literacy. Therefore, it was not created for investment solicitation. The final investment decisions are to be made at your own risk.

<Please click to support us. Thank you. m(_ _)m>