With a signal that indicates long-term trend reversals and short-term pullbacks 『天底チャート MT4 』
No repaint!
Signs that show long-term trend reversals and short-term pullbacks
“Tento Chart MT4”
■What is Tento Chart…
First, please take a look at the Tento Chart.
There are three points to check!
1. White arrows – reversal signals in the upper and lower zones (ceiling zone, bottom price zone)【Reversal signals】
(High probability of being in the ceiling zone or bottom price zone)>>>Confirm entry direction
2. Check whether the moving average trend is pointing up or down
3.Green・RedArrows – outside the upper and lower zones (not in the ceiling or bottom price zones)Trend-following signals
(Possibility of pullbacks buying in uptrends, and rallies selling in downtrends)
>>>Entry points for pullbacks and retracements
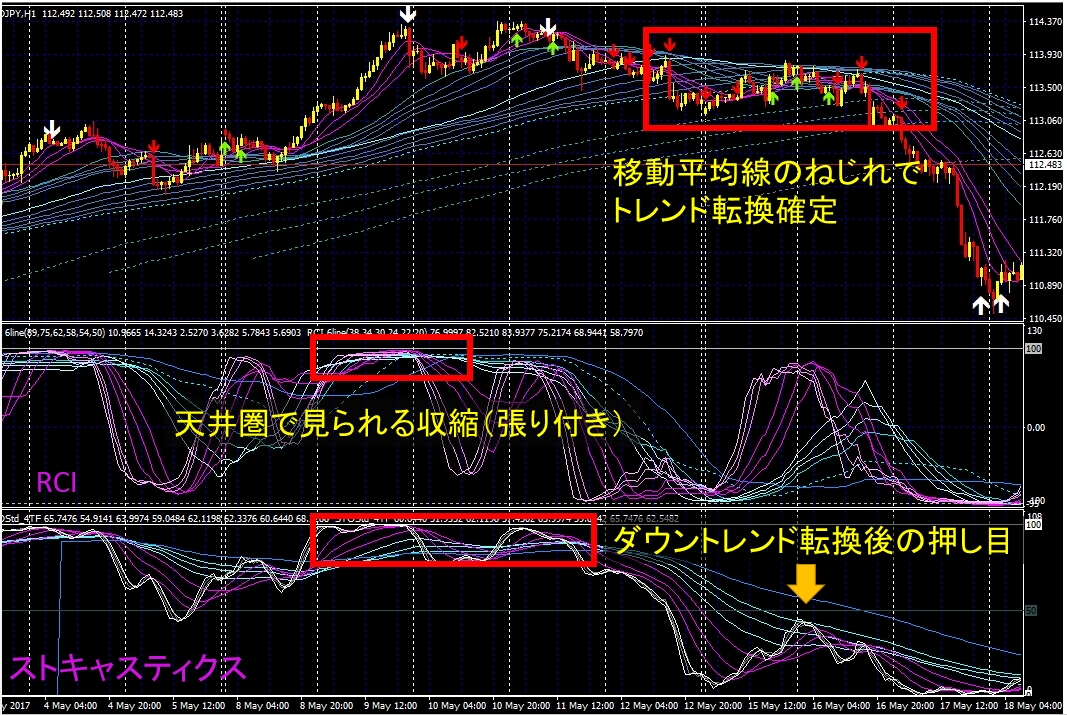
『 When multiple RCI and Stochastic bundles converge at the lower bound and, after crossing, begin to spread upward,
and additionally the candlesticks appear above the moving average band, it indicates a buy reversal (uptrend).
Conversely, when multiple RCI and Stochastic bundles converge at the upper bound and, after crossing, begin to spread downward,
and the candlesticks appear below the moving average band, it indicates a sell reversal (downtrend)』
This is a chart template that lets you see that at a glance.
■Not only the signals, but understanding the meanings of RCI, Stochastic, and moving averages dramatically increases win rate!
By using RCI and Stochastic across multiple time frames, you can understand the trend and pullback conditions.
RCI:Indicates oversold and overbought; you can treat a rebound from around ±80% as a contrarian timing signal. A drawback is that when a trend appears, it may cling to the highs and lows, making timing difficult. You can also view the direction by whether it is above or below 0%.
By multi-time-frame analysis, pullbacks and retracements within the trend become identifiable.
Stochastic:Indicates oversold and overbought and is used as a contrarian indicator.
With the Tento Chart’s unique multi-timeframe setting, you can view larger timeframes simultaneously and understand the trend direction.
The white band line is the current timeframe line. If the higher-timeframe line is above the white line, the direction is downward,
and if the higher-timeframe line is below the white line, it is upward.
Moving AveragesUsing 17 moving averages from 8 to 400 days allows you to grasp the trend direction from a broader perspective than RCI or Stochastic.
By correctly understanding these three indicators, you can view the chart more holistically.
■Do not enter here! Be careful of contrarian signals that go against the trend
From just this image, you might think the reversal signal (white) isn’t actually reversing at all!
You might think so, but
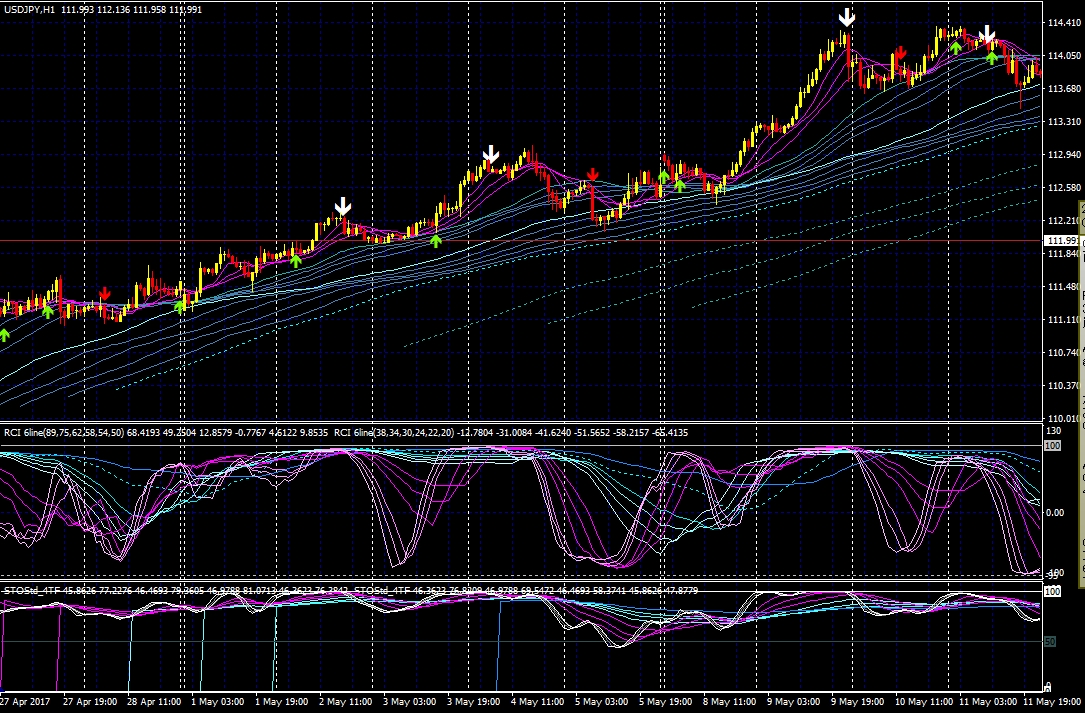
When checking entries, looking at the important “moving average” shows that we are entering a strong uptrend
you can see.
In such cases, filter reversal and contrarian signals and avoid entering, which dramatically increases win rate.
Following the direction of the higher timeframe is a basic principle of trading, so simply following signals isn’t enough.
If you add a direction filter to the previous chart and analyze…
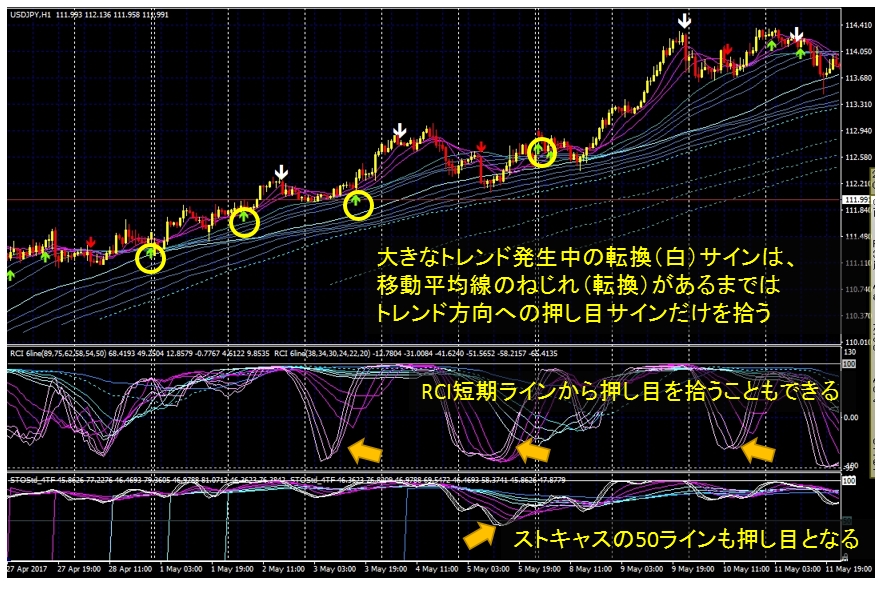
The yellow circle area becomes the entry point, allowing you to extend profits.
■The point is to memorize winning and losing patterns across various scenarios
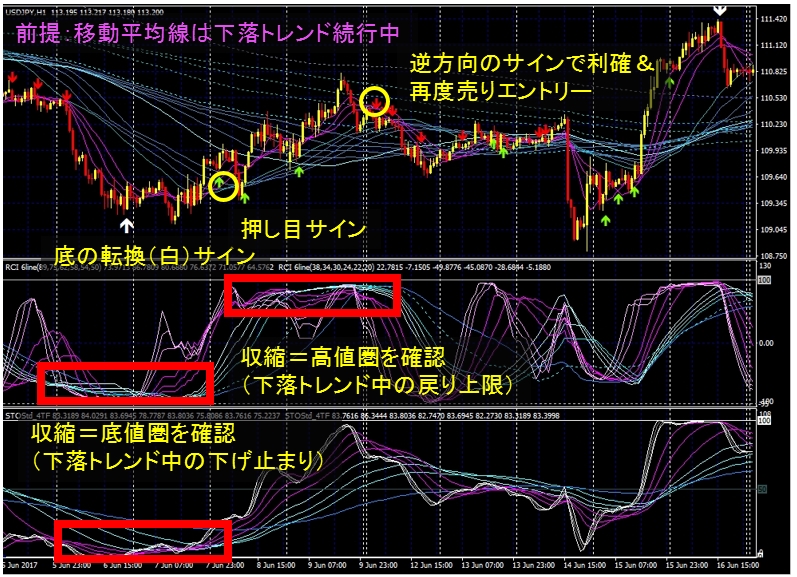
(Premise)In a gentle downtrend
(Check signals and conditions)If a reversal (white) signal appears and convergence with RCI and Stochastic is confirmed, it’s judged as a weak buy signal, and you enter with the green buy signal.
(Take profit)However, since it’s in a downtrend, take profit when the opposite red (sell) signal appears, or when the short-term line crosses below the long-term line.
■The Tento Chart manual is fully released
For more detailed chart interpretations and pattern examples, please refer to the completely free manual.
Also, since the signals are for the hourly chart, it is recommended for those who want to trade with a relaxed, trend-following approach.
More details here
↓↓↓↓