
"The fastest way to become a full-time trader" A method for beginners to improve trading skills efficiently without waste.
■ What you can gain
・You will know entry points with high win rates
・You will understand where to look on the chart
・As you can see the market trend, you will determine the perspective of whether it will rise or fall
■ Spoiler
I’ll summarize the method we’re introducing this time upfront.
If it doesn’t suit you, thank you for reading up to here. <(_ _)>
・Select currency pairs that are likely to show a trend on the 1-hour chart
=Only check currency pairs that are likely to trend and wait for the entry timing
For example, currency pairs that have surged and then become ranging are likely to lose, so we don’t trades them.
・Look at the 5-minute chart to find easy entry points
=In an uptrend, after a brief drop, enter from the bottom rising again
Set a stop loss of 10 pips and look for points where the profit potential seems to widen.
■ Who this method suits
・People who want to trade only in high-win-rate situations
・People who prioritize “winning without letting positions go negative” above all
・People who want to gain experience through a practical format rather than memorizing theories
We regularly check the 1-hour chart, so if you can enter early in the trend’s onset, chart checking doesn’t feel burdensome. That is a good fit for those.
If you consistently monitor the chart from morning to evening to night, you will accumulate experience: for example, “USDJPY rises but tends to reverse around around 104.00 yen, so it’s likely to fall.”
Having knowledge from books is nice, but as you gain experience in candlestick movement patterns, you can enter with confidence when trading real funds.
Many professional traders have looked at charts tens of thousands of times, and can tell whether price will go up or down just by looking at candlesticks.
If you’re interested, learning “Sakata Gohō” (five rice rules) can help predict candlestick movements.
As you get used to the task, after looking at a chart once, you’ll be able to narrow down the currency pairs to watch, so regular checks can be shortened to a few minutes.
Example: GBP pairs are currently in the late stage of a trend, so you don’t need to check them until around the London session in the evening.
■ People this method does not suit
・People who only look at daily or 4-hour charts (long-term charts)
・People who want to trade using a specific trading method
・People who scalping on seconds or minutes
If you dislike looking at timeframes smaller than the 1-hour chart and trading in small increments, or you’re already using a specific trading method, this approach may not fit you, so it’s not recommended.
Also, if you engage in heavy 1-minute scalping, your daily number of trades will drop to a few, so you won’t feel satisfied, so please avoid it.
■ Where to trade? How to read the chart
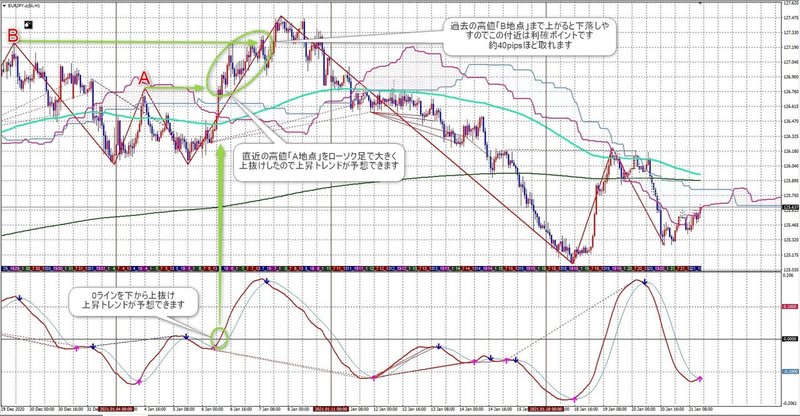
Figure: EUR/JPY 1-hour chart, week of 2021/1/4 (Mon)
《In the case of an uptrend》
A long bullish candlestick appears, the oscillator crosses the 0 line from below, and after surpassing the recent high point A, the price surges with momentum.
The take-profit target is near the past high at point B.
When candlesticks reach point B, they reverse downward, so taking profit near point B is recommended.
《Where do you enter?》
Entry points are checked on the 5-minute and 1-minute charts.
Check on the 1-hour chart whether a trend will form, then check only the currency pairs likely to move on the 5-minute chart.
《If it has risen above point B, can you widen the profit margin further?》
On the chart, after reaching B, price dips and rises again.
This is likely the late stage of an uptrend’s impulsive wave (Elliott Wave 5th wave).
In the late-stage trend movement, predicting whether it will rise or fall is difficult, so you should gain experience and test it yourself.
For example, you can take profits halfway and keep the remaining half to extend the profit margin.
■ If you ride a downtrend, can you gain +100 pips?
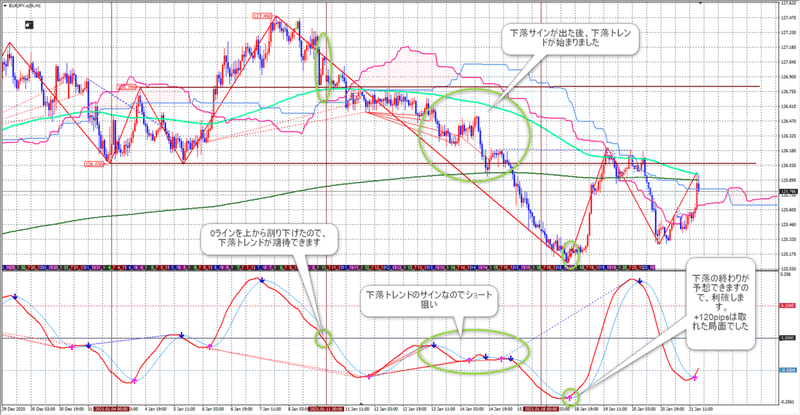
Figure: EUR/JPY 1-hour chart, week of 2021/1/11 (Mon)
《Riding the downtrend》
A long bearish candlestick appears, price moves below the 0 line on the oscillator, and after bearish and bullish candles appear irregularly, the decline starts.
In this case, after a death cross just below the 0 line, the decline begins, with some rise, but in the latter part of the week the candles are mostly bearish, indicating a downtrend.
《Where to enter?》
In this case,
・If the oscillator breaks below the 0 line from above, aim for a short entry
≒ Do not go long
・In particular, after a death cross just below the 0 line, you want to wait for entry points on the 5-minute or 1-minute chart.
■ What happens if you view a 1-hour downtrend on the 5-minute chart?
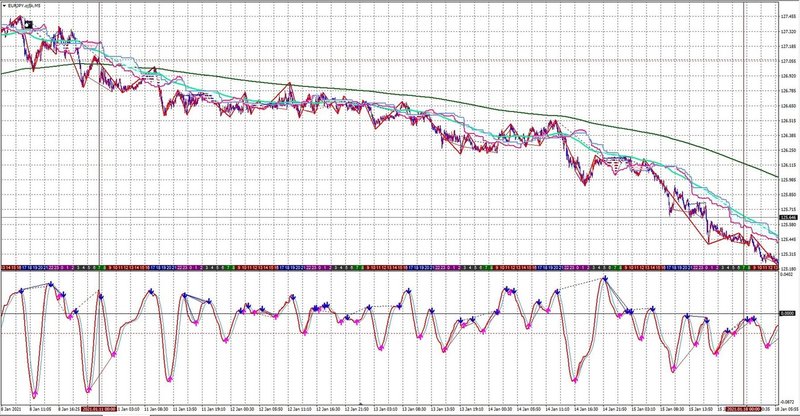
Figure: EUR/JPY 5-minute chart, week of 2021/1/11 (Mon)
《Entry point》
・When the candlesticks approach the moving average (dark green)
・After the oscillator shows a down arrow, enter short
・Set stop loss a little above the moving average by about +3 pips
(A stop loss width of about 10–15 pips is desirable for money management)
《More details!》
I summarized the method of entering on the 5-minute chart after checking the 1-hour chart in this article.
↓
《Secrets of a winning entry point》
■ There are too many currency pairs! Which ones should you view at minimum?
Most brokers offer more than 20 currency pairs.
If any of the following match you, give them a try.
《Pound-based currency pairs》
Because the price range is wide, if you win with a high win rate, your capital grows rapidly
Be aware that the spreads can be wide and sudden changes can occur, which are negative factors
・GBP/AUD, GBP/NZD:
Varied enough to target +100 pips or more. However, prices can swing and stop out quickly, so do not over-leverage.
・GBP/USD, GBP/JPY:
They are the main pound pairs, so it’s important to know whether they are rising, falling, or in a range.
・GBP/CAD, GBP/CHF:
Similar to GBP/AUD, GBP/CHF, they have decent movement.
・EUR/GBP
There are cases of strong trends, so you should check it.
《Euro-based currency pairs》
Spreads are narrow, and trends can produce large price moves.
EUR/USD, EUR/JPY offer opportunities to enter when the stop loss is around 10 pips.
《USD/JPY》
Spreads are narrow and there are many ads and campaigns, which many may like.
USD/JPY has high trading volume including scalping and automated trading, and trends can be choppy with many ranging movements.
(For beginners, losses may lead to funds leavingFX brokers!?)
■ I am a complete beginner, where should I start? (・・?
If you can operate a computer or tablet, start with a demo account recommendation for entry.
Enter when you think price might go up or down on the demo account.
After a few hours, review the entry results
If it’s positive, record as a winning example
If it’s negative, record as a losing example
By studying every night or on weekends and reviewing winning and losing scenarios, your experience will steadily increase.
■ What if the number of “winning cases” increases?
If many winning-case charts with similar shapes accumulate
Using that as one single method yields a “high-win-rate entry point.”
■ Grow your capital by more than 10 million yen
When you have a high-win-rate entry point, start with a demo trade
↓
“Three months of profit consecutively” or “assets double within one month”
↓
Begin trading with real funds
↓
In six months to a year, your capital should increase to about 10 million yen (assuming compounding)
↓
The following year, file a tax return (be aware that if annual gains are positive, there may be 20% tax)
※The tax information above is general and taxation varies by individual.