

The Secret to a Winning Entry Point that Transforms in 5 Minutes
■ What you can gain
・ You can see a entry point that is easy to win
・ You can find the stop-loss point
・ You can grasp the timing for taking profits
■ Which chart time?
EUR/JPY from last week, 2011/1/11 (Mon) to 2011/1/15 (Fri)
Explained on the 1-hour and 5-minute charts
■ Reviewing EUR/JPY's week on the 5-minute chart
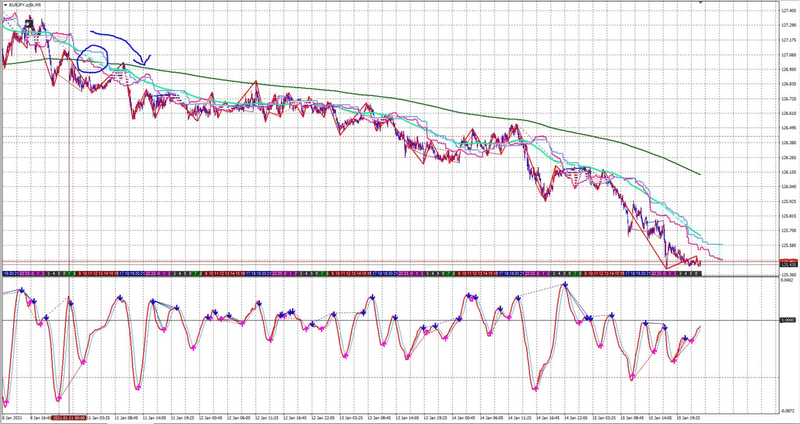
Figure 01: EUR/JPY 5-minute chart (week of 2011/1/11)
After the two moving averages crossed (blue circle position) and touched the long-term moving average (dark green line) twice, the price continued to fall throughout the week.
Conclusion: it was a situation where going short would have been profitable, but to “minimize the loss” and “maximize the profit”
Q: Where should one enter?
Q: When should you look at the chart and wait for a breakout opportunity?
■ What to look at on the 1-hour chart?
In short, you look at whether there is an entry opportunity.
More precisely, consider whether a new trend will emerge, and decide if the currency pair deserves regular checks or if you can leave it alone for a while.
・Which currency pairs to check frequently?
Pairs where the first wave trend appears and the third wave might occur
・Which currency pairs not to monitor for a while?
Pairs where the third wave has already appeared, or where the trend is in its late stage and direction is unclear
■ 1-hour chart
Basically, when a dead cross occurs on the oscillator, look for the entry point on the 5-minute chart.
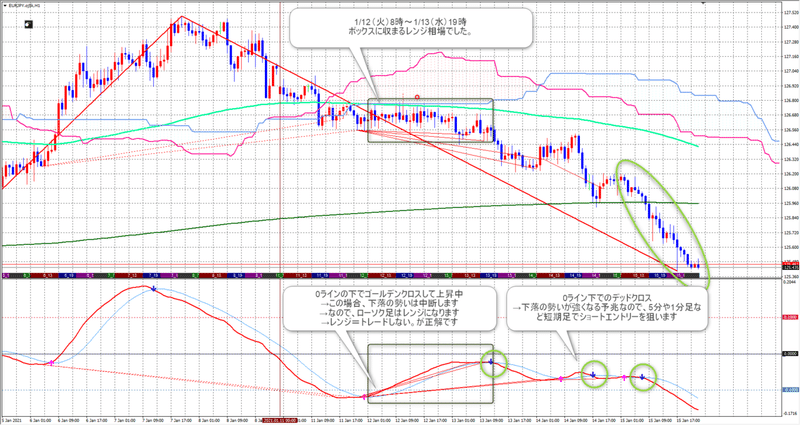
Figure 02: EUR/JPY 1-hour
As a rule, if the oscillator crosses below the 0 line, check the 5-minute or 1-minute charts.
As shown above, when the price drops from above the 0 line to below it and then crosses dead below the 0 line, a strong downtrend occurs.
In the above image, from a range where bearish and bullish candles are mixed to a downtrend where bearish candles continue, it is clearly shown.
● Caution:
A big trend does not always follow a range.
During the range, the downward momentum can strengthen from 1-minute to 5-minute to 1-hour charts, so it can happen that the downside ends at the 5-minute level and reverses upward.
Therefore, even after entering, by routinely checking whether a big trend will develop, you can capture large profits like 100 pips.
■ 5-minute chart: Entry method
Enter on a dead cross of the oscillator while considering the stop-loss line.

Figure 03: EUR/JPY 5-minute chart
In the above, since the 1-hour dead cross,
・Use the following as stop-loss reference:
① Daily chart level “126.198”
② Moving average (lime color)
③ Moving average (red and blue)
In this case, the candles rise close to the daily line and the moving averages, and
when the oscillator crosses dead below, you want to enter short.
■ 5-minute chart: Taking profit timing
In principle, take profits at the daily chart level.
Or take profits at key round numbers like “125.00” yen.
Reason: once the price reaches a commonly watched level, profit-taking orders come in, causing the market to reverse. (By securing profits before a reversal, you capture larger profits)
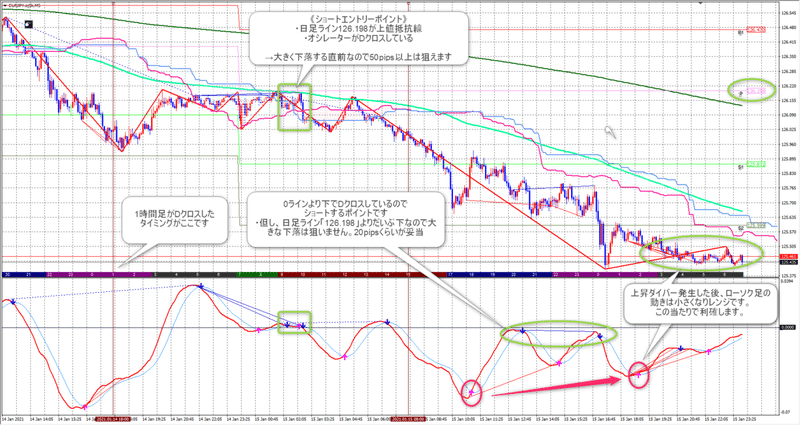
Figure 03: EUR/JPY 5-minute chart
Besides “take profits at a key price level,”
in the above, I would like to take profits for the following reasons
・Oscillator shows divergence with upward movement
(Divergence: price candles are falling while the oscillator bottoms are rising)
・Candles shorten in length, forming a range with mixed bullish/bearish candles
・If you don’t settle and carry to next week, you risk “gap opening” reducing the profit
(Gap opening: on Monday early morning after weekend closures, prices often start at a higher or lower level)
・Profit is already +50 pips
Once you’ve secured a reasonable profit, prioritize growing capital by taking profits
■ Fundamental analysis
In this case, indicators and such are not particularly considered. (^_^)
Reason is that a strong downtrend is detected and a short entry is made.
That said, I do check indicators likely to cause rapid market changes, such as employment statistics and FOMC.
● What is fundamental analysis?
An analysis method that uses economic indicators, political developments, etc., to forecast medium- to long-term moves in the forex market.
U.S. employment statistics releases often cause market moves within seconds.
(Monologue)
What I consider important is the “strength of the trend.”
Enter just before a strong trend occurs and take profits if it slows down.
If you can do this, your position becomes profitable soon after entry.
If the position is in profit, you can enjoy finding the profit-taking timing.
On the other hand, if the position goes into loss, you might end up with “not being able to cut losses” or taking reckless entries trying to recover losses, which will reduce your assets.
■ Do you not need mental control!?
If you can enter and take profits at high-probability points, your assets will grow quickly, so I don’t emphasize psychology in trading.
Even Ichiro, who is said to have strong mental fortitude in baseball, has a batting average around 30–40%, and exceeding 50% is difficult, so always prepare yourself before stepping up to bat.
It would be extremely difficult to attain Ichiro-level mentality for a lifetime...
Therefore, by learning to review when a strong trend occurs, as in this case, your win rate should increase.
By the way, a trading method that says “mental is the most important!” tends to have an impression of a win rate below 50%.