

Behind the rise: leverage trading's影
This week in Tokyo has been cool, hasn’t it?
However, BTC has reached a new all-time high. It’s hot.
Last time I predicted a battle around 450,000 yen, but once the lid was lifted, BTC quickly reached around 500,000 yen. It pulled back a bit due to profit-taking selling, and as of August 18 it is hovering around 470,000 yen.
■ The price rise is accelerating
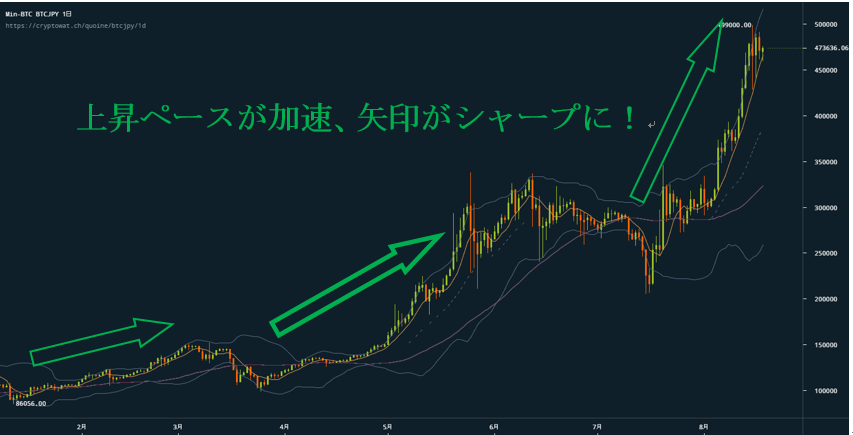
This is the BTC/JPY chart as of August 18 (technical indicators are 7-day, 50-day moving averages and Bollinger Bands 20 days, 2σ).
Looking back at the rising trend since the start of the year, the angle has been increasing each time. Price fluctuations have become multiplicatively more volatile, and price movements do not adhere to past rules of thumb. It consistently unfolds in ways that exceed imagination, making it difficult to predict the upper limit.
In such markets, technicals tend not to work well. For downside targets, the 7-day moving average or the 1σ band of Bollinger Bands seem to be somewhat reliable, but not very dependable.
■ Why does the price become so volatile
Japanese trading volume of BTC has become the highest in the world. This includes leveraged trading volumes, though in spot trading Japan is in second place. If you look only at leveraged trading, most of it is likely from Japan.
In the uptrend from April to May shown by the second arrow in the figure, it is widely believed that Japanese retail investors flowed into BTC trading and led the market. Additionally, electronics retailers and major e-commerce companies began handling Bitcoin, which increased demand for BTC in the spot market. During this period, excluding some veteran participants, leveraged trading was probably not very active. Rather, the writer believes that the price was propelled mainly by new investors holding spot positions.
However, this period ultimately became the largest bull market in BTC history, and investors who entered at the beginning of the rise achieved about 100% return in just two months.
Now, what actions might investors who felt the momentum take next? They will likely add leverage to bet on further rise. I believe this is the reason for the current expansion of price increases.
The tendency for first experiences to bias subsequent decisions is called anchoring, a representative psychological bias in humans. For many investors who entered during this period, criteria such as "the rise will continue for about two months," "the rise will continue up to three times," and "prices will only fall due to systemic concerns (hard forks)" may be overly perceived.
This will be even more persuasive in an BTC market where price has no mathematical basis. If new entrants take on excessive leverage and push prices higher, the abrupt price movements of this week make sense.
■ Supply and demand analysis moves with stop-loss orders
However, when leverage is high, the timing of declines becomes earlier and the magnitude larger, making it extremely difficult to anticipate price based on past rules of thumb.
In such cases, it is recommended to conduct supply-and-demand analysis without relying on technicals or fundamentals.
Unlike fundamentals and technicals, supply-and-demand analysis has no universal foundation. It imagines a battlefield where various buyers and sellers, all sorts of participants, are mixed and contending. Note that this is different from real demand trading in the foreign exchange market.
Now, if you nitpick, you can analyze endlessly, but in this supply-and-demand analysis, what matters is: where are the buyers the closest to their stop-loss (loss-cut) points? Because stop-loss trades must be executed mechanically due to capital constraints or trading rules, and at such moments the price balance (supply and demand) can collapse and move the market dramatically.
What happens if one of the participants in a tug-of-war trips while others are balanced? Even a small stumble can tilt the match, just as in a real tug-of-war.
In the current market, those who bought at price bands above 473,000 yen on August 15 and 17 are targets for forced selling, while those who sold at price bands below 460,000 yen are targets for short-covering.
For example, if BTC’s spot price surpasses 500,000 yen, unrealized losses per BTC would be about 40,000 yen, so it is expected that those who sold would incur losses and cause prices to rise rapidly. The buy-side stop-loss line would probably be around 450,000 yen.
■ This week’s outlook
Based on the above, if the 500,000 yen barrier is broken, short-covering and new entrants would push toward 550,000–600,000 yen; if price falls once below 450,000 yen, a trend toward 350,000 yen could occur rapidly.
If I were trading, I would place stop-orders on both sides, or if buying only, place orders in the 400,000-range and the late 300,000-range by halves.
BTC is a high-risk investment. Please make investment decisions at your own risk.
Cryptocurrency Exchange / Everyone’s Bitcoin
-------------------------------------------------------------------------------------------
【Author】
Saiou Kawada
Born in Geneva, Switzerland. Graduate of Keio University.
His global travel experiences give him a persuasive Fanmental analysis grounded in real experience.
Utilizes behavioral economics learned in college to analyze investors' psychological biases and apply them to trading.
Hobbies include shogi; as an amateur dan-level player, the mid-game tactics also inform his readings of the market’s next move.
“The masses are always wrong” is his creed.
【Disclaimer】
The Bitcoin market information and other content provided on this site reflects the author’s personal views and does not guarantee the accuracy or safety of the content by the author, Trader Securities Co., Ltd., or the company. Also, such information is provided for reference and does not constitute recommendations of specific investment actions or management methods regarding cryptocurrencies. Please make your own final investment decisions. Note that any gains or losses from investments belong to the investors. The author, Trader Securities Co., Ltd., or the company accept no liability for any damages arising from use of this information.
-------------------------------------------------------------------------------------------