

April 23 (Fri) Brand Analysis Mining
On Friday, April 23, the stock analysis
Inpex Corporation (1605)
Idemitsu Kosan (1662)
Mitsui Matsushima Holdings (1518)
all adhered to the Ichimoku cloud, moving averages, Dow Theory, and Elliott Wave Theory.
Elliott Wave Theory here is not a detailed analysis; it focuses on the shape.
Inpex Corporation (1605)
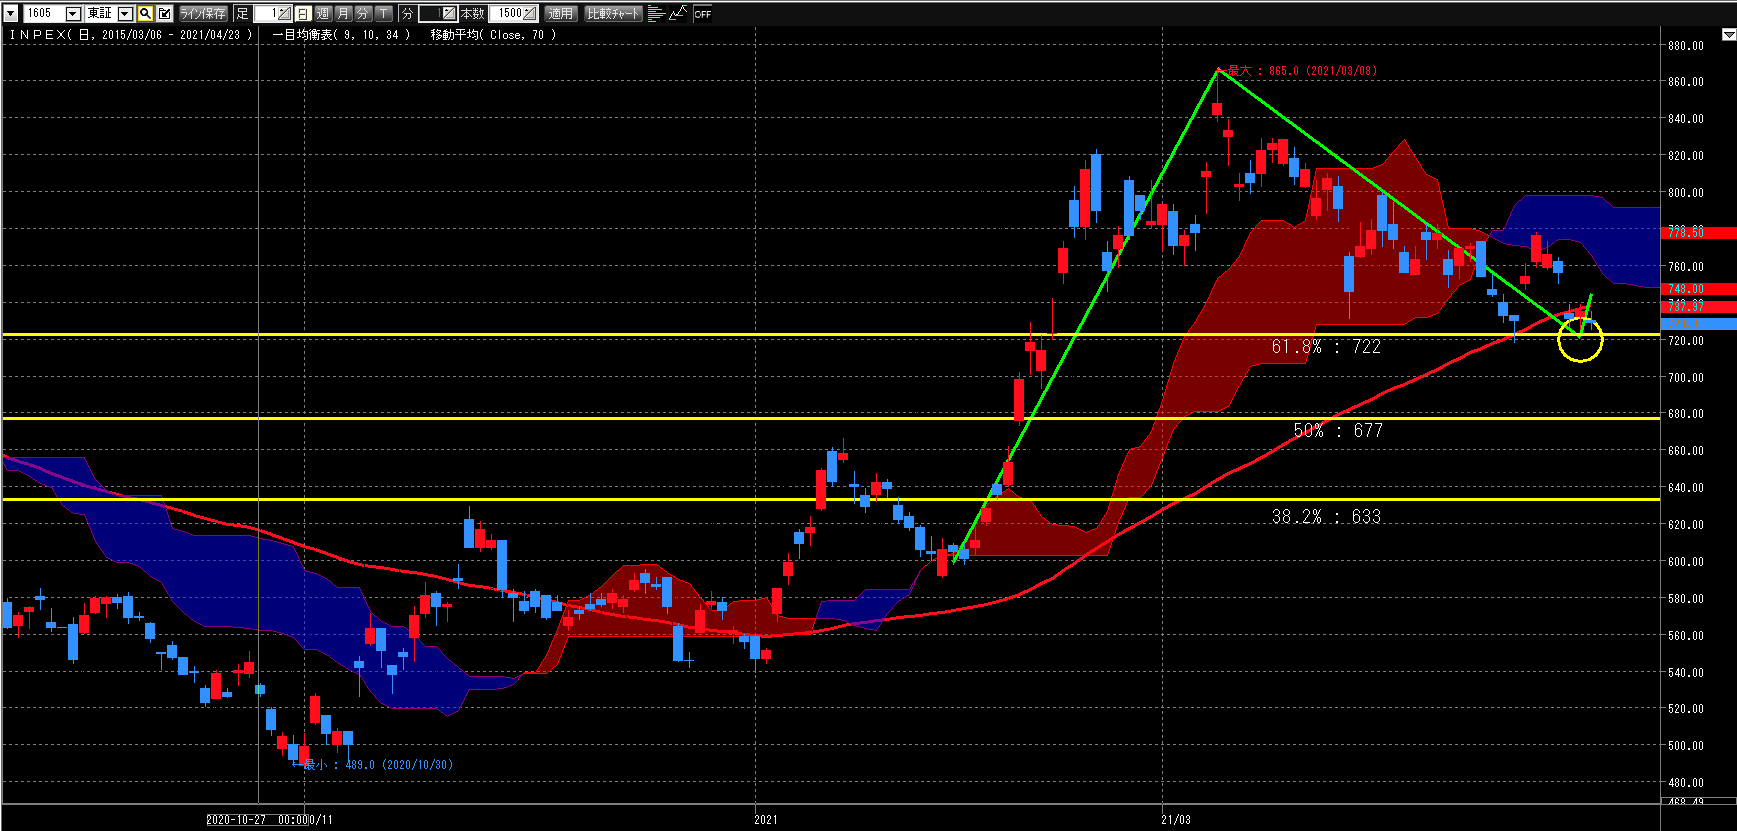
The rise has ended, and it is transitioning into a downward trend according to Dow Theory.
Whether the brief return within the cloud is perceived as a downtrend is unclear, but attention is on whether the current price level will break below.
If the brief return is being considered, there is a possibility that Elliott Wave a-c waves are in play, and if recognized as such, the next
trend could begin.
If not recognized, the charted rebound may be seen as a-b waves, with 50% at 677 and 38.2% at 633 likely to be watched next.
Resourceful Gas Development (1662)
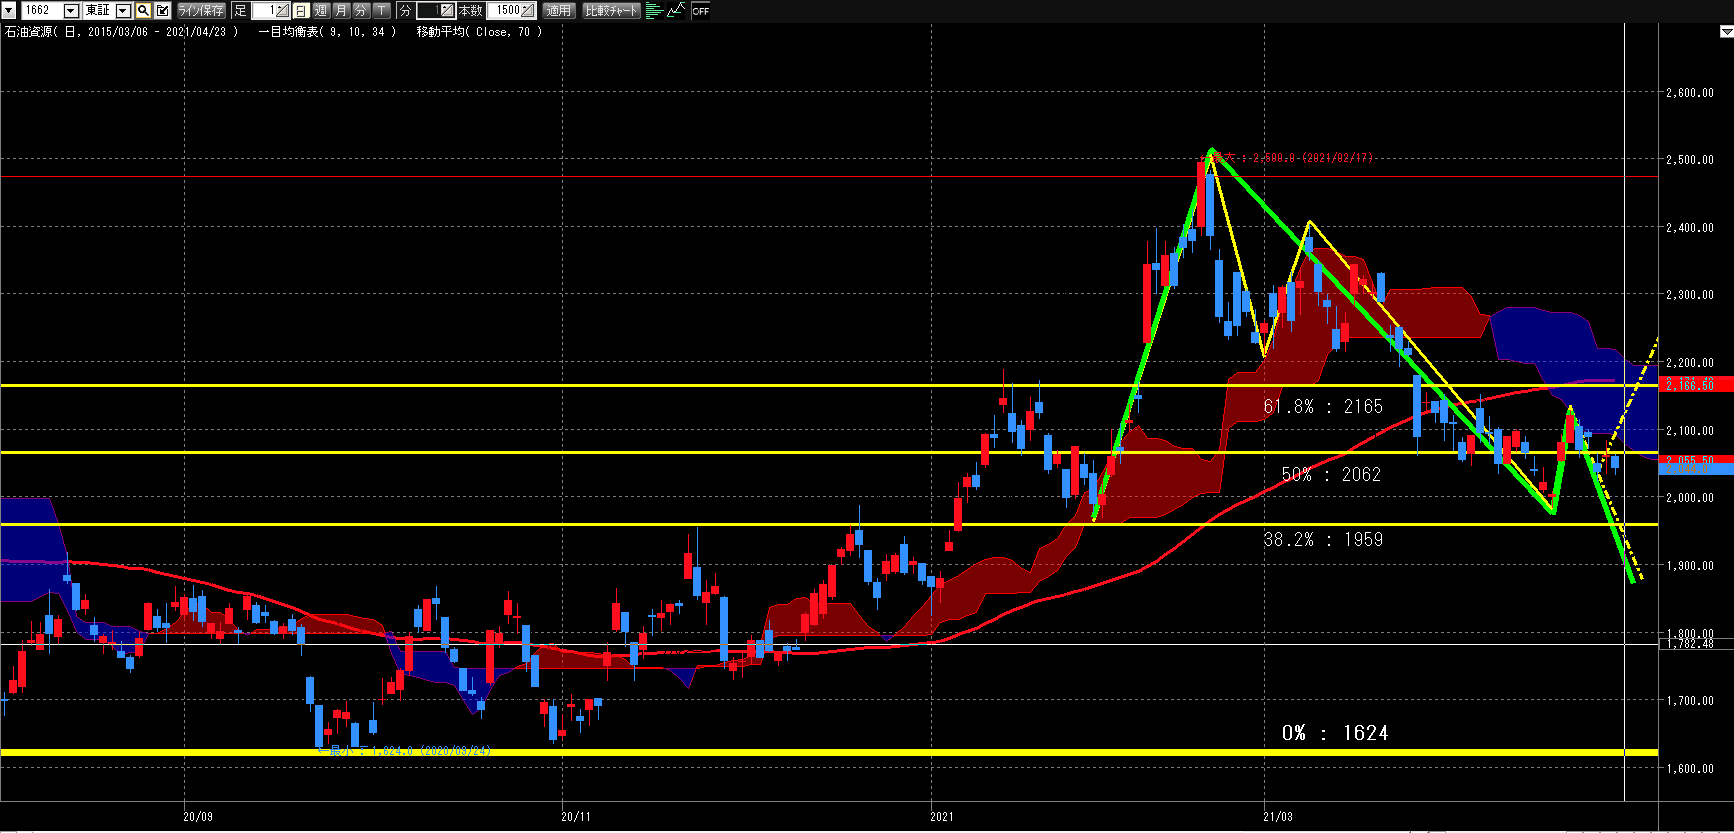
There are two interpretations, split into two perspectives more than Inpex.
In the case of the green-taded scenario, it is a downward move from the formation of Elliot Wave a-b into wave c.
In the yellow case, after forming the a-c wave, the next wave could go up or down, branching depending on which path it takes.
From a flag pattern, there is a retrace and possible resurgence, or a temporary drop within a larger upward move; the 38.2% level of 1959 seems to have been noticed, and further decline may require some force, implying rising momentum or a wait-and-see stance.
Of course, there is also a possibility to 100% retrace to 1624, so caution is needed to see whether it can break again below 38.2%.
Breaking below 1624 would constitute a Dow Theory downtrend, and if forced to fit Elliott Wave Theory, could indicate the next 1-3 waves to come.
Mitsui Matsushima Holdings (1518)
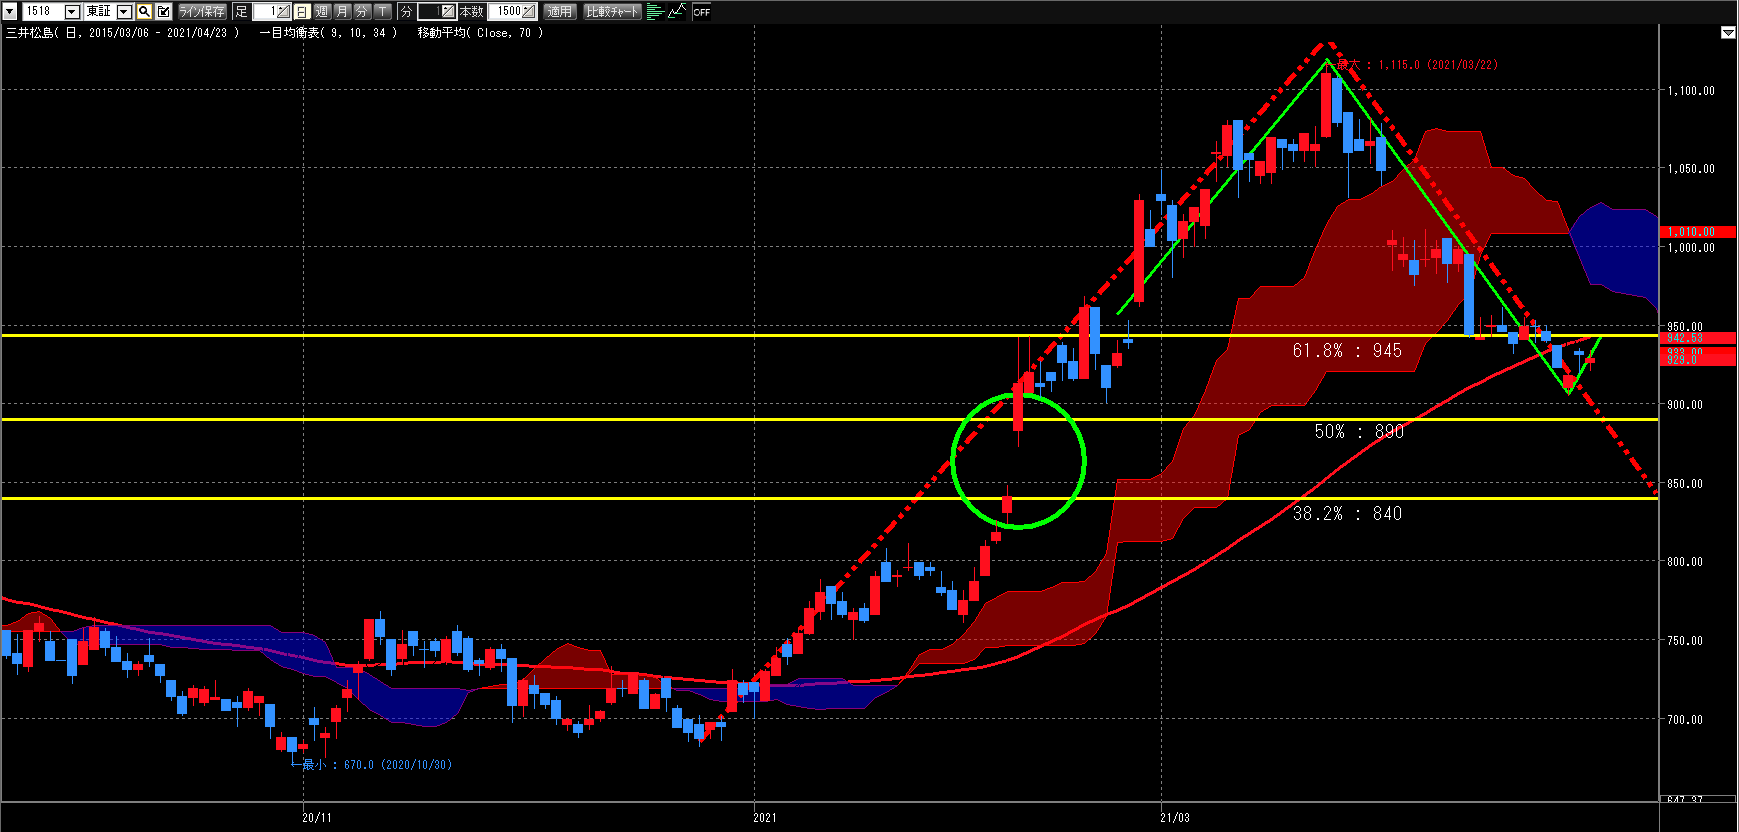
Compared to the other two, the pattern is somewhat better (cleaner).
After reaching highs, there is a clean rebound; if viewed as the formation of a-b waves, the shape is solid, but since 50% at 890 is already in focus,
even if it breaks out, momentum may fade at 840, the 38.2% level.
Also, the 38.2% level of 840 aligns with a gap opened between February 5 and February 8 in the green circle, making it more likely to be watched.
If it breaks below 840, a 0% retrace is possible, but if strongly driven higher, on a larger view, it could form an Elliott Wave a-b wave as indicated by the red dashed line.
The minerals section ends with this.
If there are many analyses by sector, I plan to split them into multiple parts.
After completing the stock analysis round, I will re-analyze to find timely stocks.
Next time, we will analyze stocks in the "Construction" sector.