

Point to Narrow Down Entries, Part 2
Hello!
I’m Satorin, a research analyst of FX and binary strategy.
Today, as “Points to Narrow Entry – Part 2,”
continuing from the last 5-minute chart, I’ll share examples for the 15-minute, 30-minute, and 1-hour charts.
The figure below is a long (buy) case for USD/JPY on the 15-minute chart.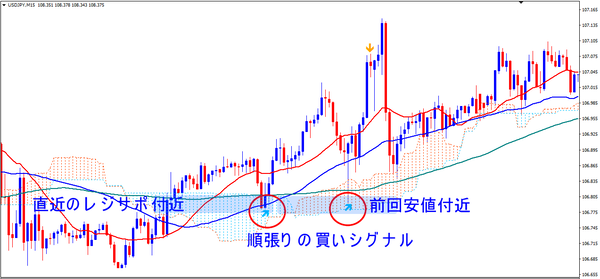
https://livedoor.blogimg.jp/fxmt4indicator/imgs/0/4/04c1a64f-s.png
From the above image, you can see that the early stage of an uptrend is captured with a buy signal.
Since real-time signals are also available, you can enter the second buy even before the close of the candle.
The figure below shows a long (buy) and short (sell) case for EUR/USD on the 30-minute chart.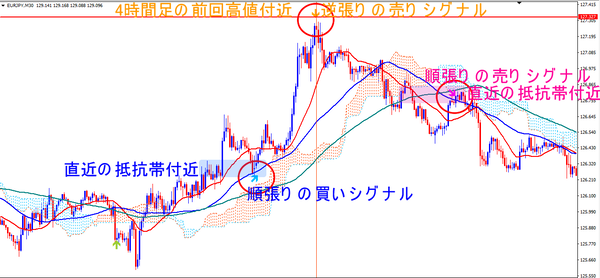
https://livedoor.blogimg.jp/fxmt4indicator/imgs/7/f/7fd20d4b-s.png
The short selling signal in the reverse (mean reversion) case in the above image targets the previous high on the 4-hour chart, so it is a case for entry.
The previous high and low on the 1-hour and 4-hour charts should be treated as resistance zones.
The figure below shows a long and short case for GBP/USD on the 1-hour chart.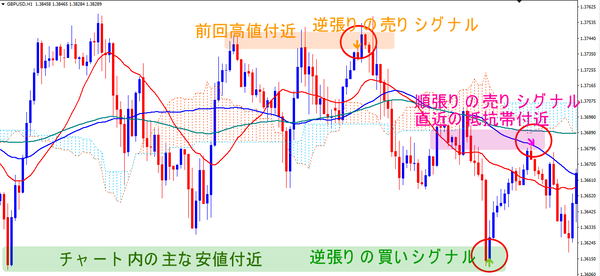
In the above example, closing the position at the red 20MA results in a 3-win streak.
By the way, the red line is 20MA, blue is 50MA, and green is 100MA.
As for cases where you close on the 20MA on the EUR/USD 15-minute chart, as shown below,
they yielded +9 pips, +6 pips, and +7 pips.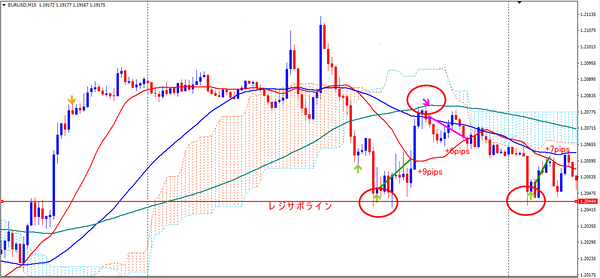
Here is a rough summary of the last 10 days for each timeframe:
1-hour chart: signals 3 times, average win 18 pips, average loss 18 pips
30-minute chart: signals 6 times, average win 12 pips, average loss 12 pips
15-minute chart: signals 12 times, average win 8 pips, average loss 8 pips
5-minute chart: signals 20 times, average win 5 pips, average loss 5 pips
The signals themselves are about twice the above, but if you narrow entries with awareness of resistance zones, it becomes about half as often as above.
The win rate is 70% to 80%, so if we take 70% as the rate, the rough pip gains per currency over 10 days are as follows.
1-hour chart: 2 wins, 1 loss, 18 pips × 2 − 18 pips × 1 = +18 pips
30-minute chart: 4 wins, 2 losses, 12 pips × 4 − 12 pips × 2 = +24 pips
15-minute chart: 8 wins, 4 losses, 8 pips × 8 − 8 pips × 4 = +32 pips
5-minute chart: 14 wins, 6 losses, 5 pips × 14 − 5 pips × 6 = +40 pips
Note: The stop-loss width is set to the same as the average winning pips, but if buying, adjust slightly below the resistance zone as appropriate.
The indicators used today are as follows.
Hiking Wave Indicator
https://www.gogojungle.co.jp/tools/indicators/25776
Thank you very much for reading up to here today as well.
Email: info at mark canary2.net
※Registration for “FX Wave Riding Free Newsletter”
https://1lejend.com/stepmail/kd.php?no=UbHSvri