

Nikkei 225 will remain to be watched carefully starting next week and beyond!
On the Tokyo stock market on the 26th, selling surged amid vigilance for rising U.S. long-term interest rates,
and it was almost broadly negative.
The Nikkei Stock Average ended at 28,966.01 yen, down 1,202.26 yen from the previous day.
Therefore, when looking at the Nikkei 225 chart with Mebius-UV,
on a weekly basis,an inverted V shapeappeared.
and it was almost broadly negative.
The Nikkei Stock Average ended at 28,966.01 yen, down 1,202.26 yen from the previous day.
Therefore, when looking at the Nikkei 225 chart with Mebius-UV,
on a weekly basis,an inverted V shapeappeared.
Nikkei 225 (JPN225) weekly (as of February 26) (Click the image to enlarge)

When an inverted V appears in the peak area, a decline from that point is likely to begin.
Therefore, the Nikkei 225 should remain vigilant for declines from next week onward.
Therefore, the Nikkei 225 should remain vigilant for declines from next week onward.
Examples of declines from the peak area
・After the Mebius-UV indicator line touches the upper limit several times,
the green line converges horizontally
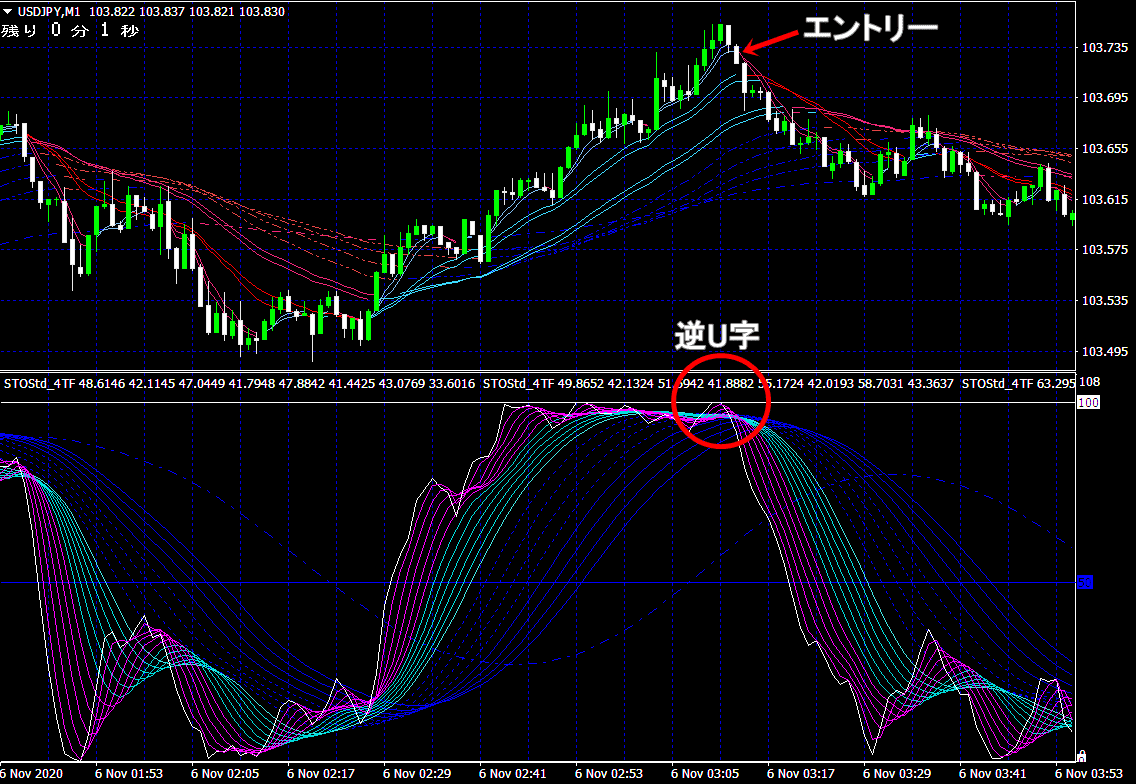
・In the final reversal after the rise, the Mebius-UV white linebecomes
“inverted Ushape or inverted Vshape.
・The white line touches or crosses the horizontal green line, indicating a low entry
・If you cross the blue outer frame line, additional entries are also possible.
× ![]()


