

2/22 Horizontal Line Chart Analysis [Nikkei 225] ★ Koropokkuru ~ Automatically displays horizontal lines ~ (Indicator)
Hello everyone! This is Yururi mo Yururi.
This time, about the Nikkei 225, in the article shown with Koropokkuru - Automatic horizontal line display - using a chart analysis based on horizontal lines with horizontal lines.
We have published the parameter settings of the indicators used for the chart display,so for those considering purchasing this indicator, of course, even if you have already purchased it, you may find it参考になるかと思います。 <通过> ◎
Chart analysis using horizontal lines
Chart data is provided by “Golden Wealth Japan (FXTF)”.
The indicator used is ‘Koropokkuru - Automatic horizontal line display~’.
Also, the parameter settings used for each indicator are described in the chart results, so we would appreciate your reference.
<Basic information>
◎ Nikkei 225
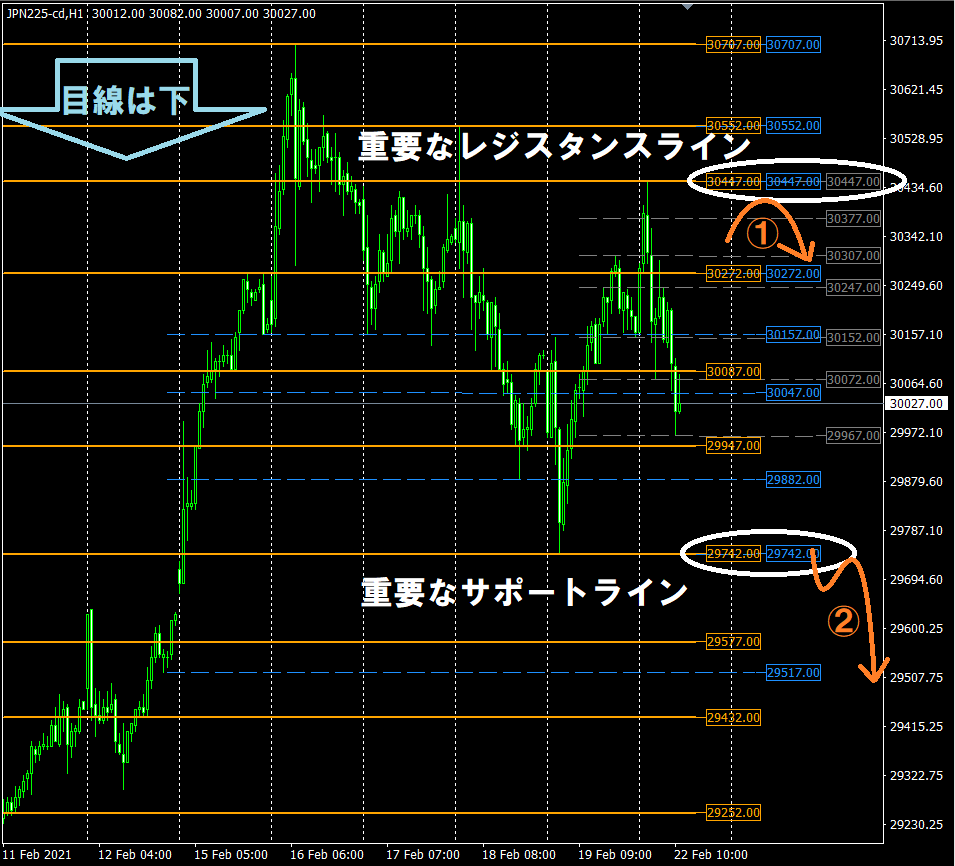
From a market outlook perspective, since highs are being made lower, a downward trend continuation seems likely, so we consider a scenario of selling on retracements.
Important resistance line … around 30447
Important support line … around 29742
<Possible scenarios>
Orange Arrow ① … aiming at “selling on retracements” that occur when the important resistance line at 30447 cannot be broken
Orange Arrow ② … aiming at “selling on retracements” after a break of the important support line at 29742 (roll reversal)
◎ Used parameters
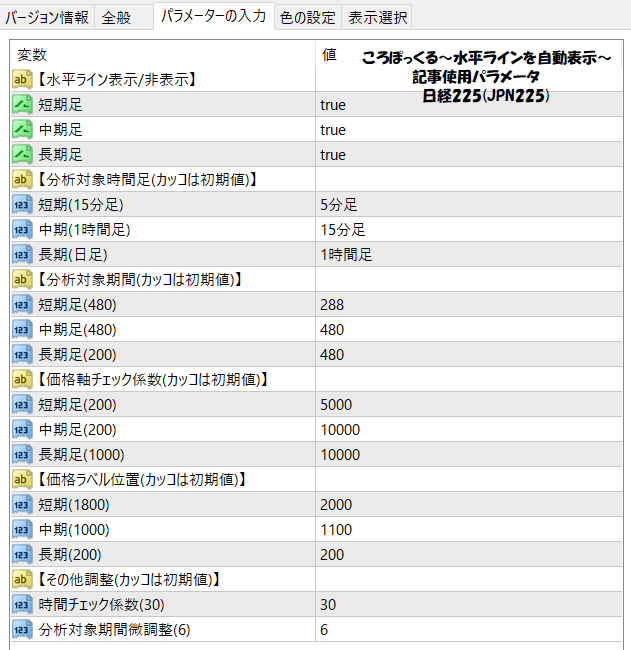
▼What is ‘Koropokkuru - Automatic horizontal line display -’
This indicator is designed to automatically display horizontal lines to reduce trading burden.
It analyzes the highest and lowest prices within a set period by price band and automatically displays up to three optimal horizontal lines for each of multiple timeframes.

◎ Suited for
☆ FX traders from beginner to intermediate Those who have studied FX trading to some extent have probably drawn horizontal lines by applying learned knowledge. In doing so, you may have had the following concerns: ・ It takes time to check the market to draw horizontal lines. ・ Drawing too many horizontal lines makes the chart hard to read. ・ I’m not sure if the horizontal line I drew is correct. ・ I don’t know how long the drawn horizontal line remains valid. ・ It’s difficult to determine take-profit and stop-loss points.
This indicator solves all these problems!
◎ Features
This indicator has the following features. ○ Automatic display of horizontal lines ・Automatically displays according to the latest situation. ・Horizontal lines are automatically updated. … in other words, it saves the trouble of drawing lines! ○ Adjustable display interval for horizontal lines ・Display frequency can be freely adjusted. ・If displayed sparingly, the chart won’t become hard to read. … in other words, you can customize as you like! Furthermore… the price at which the horizontal lines are displayed makes discretionary trading easier!
◎ How to use
Using it is very easy!Product introduction pageintroduces 3 patterns of usage, so please take a look!

◎ Summary
We also sell other products useful for trading!
<<[Set Sales] Koropokkuru - Angle is King Series >>

We also analyze the market on the blog