

2/19 Horizontal Line Chart Analysis [Bitcoin JPY] ★ Coropokuru ~ Automatically display horizontal lines ~ (Indicator)
Hello everyone! This is Yururi and Yururi here.
This time, about “Bitcoin/Yen,” in the article shown by Koropokkuru - Automatic Horizontal Line Display,Koropokkuru - Automatic Horizontal Line Displaywe analyzed charts using horizontal linesand wrote an article.
We have also disclosed the parameter settings of the indicators used for chart display, soeven if you are considering purchasing this indicatoror you have already purchased it, you may find it helpful.
Chart analysis using horizontal lines
Chart data is provided by “Goldene Way Japan (FXTF).”
The indicator used is ‘Koropokkuru - Automatic Horizontal Line Display~’.
In addition, the parameter settings used for each indicator are described in the chart results, so we would be grateful if you could refer to them.
<Basic information>
◎ Bitcoin/Yen
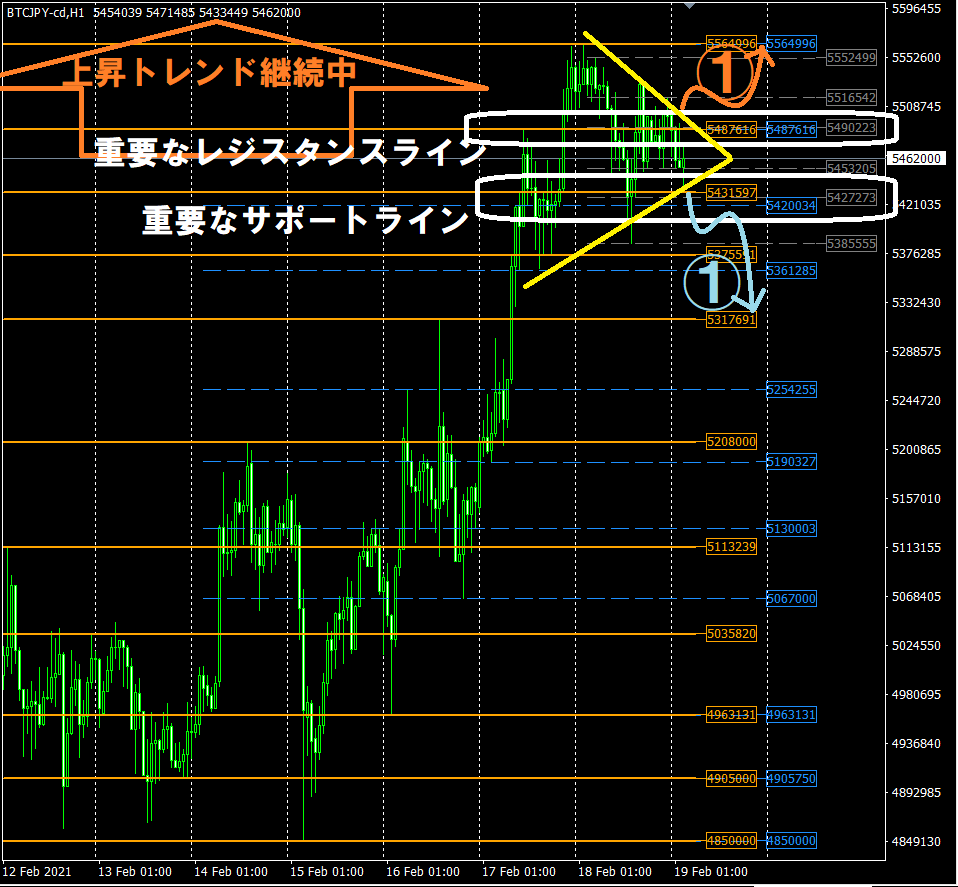
I see an unflagging uptrend continuation. It fell yesterday, but the low did not make a new lower low, so it is highly likely to be a pullback for a consolidation.
If you connect the recent highs and lows, you can draw a yellow triangle, indicating a “triangular consolidation,” and because it is an uptrend, a breakout upward is considered highly likely.
Important resistance line … around 5,490,000
Important support line … around 5,425,000
<Possible scenarios>
Orange arrow① … Break above the important resistance line 5,490,000 and break out of the triangle, aiming for a pullback (roll reversal) after the breakout, i.e., a “buy on the dip” strategy
Light blue arrow① … Break below the important resistance line 5,425,000 and break downward from the triangle, aiming for a pullback (roll reversal) after the breakout, i.e., a “sell on the rally” strategy
◎ Used parameters

▼ What is “Koropokkuru - Automatic Horizontal Line Display”
This indicator was created to automatically display horizontal lines and reduce trading burden.
It analyzes the highest and lowest prices within a set period by price band and automatically displays up to three optimal horizontal lines for each of multiple timeframes.

◎ Recommended for
☆ FX traders from beginners to mid-level Those who have studied FX trading to some extent may have drawn horizontal lines using the knowledge they learned. In doing so, have you ever had the following concerns? ・ It takes time to check the market to draw horizontal lines. ・ Drawing too many lines makes the chart hard to read. ・ You’re not sure whether the lines you drew are correct. ・ You don’t know how long the lines you drew remain valid. ・ You have trouble judging take-profit and stop-loss points.
This indicator solves all of those problems!
◎ Features
This indicator has the following features.○ Automatic display of horizontal lines ・Displays automatically according to the latest conditions. ・Horizontal lines are updated automatically. … so you don’t have to draw horizontal lines manually! ○ Adjustable display interval for horizontal lines ・Display frequency can be freely adjusted. ・If displayed sparingly, the chart is not cluttered. … in other words, you can customize as you like! Furthermore, because prices at which horizontal lines are drawn are displayed, discretionary trading becomes easier!
◎ How to use
Usage is very simple!Product Introduction Pageintroduces three patterns of usage, so please take a look!

◎ Summary
We also have other products that help with trading!»
<<【Set Sale】 Koropokkuru - Angle is king series >>>

We also analyze markets on the blog