

2/18 Horizontal Line Chart Analysis [Gold USD] ★ Koropokkuru ~ Auto-display Horizontal Line ~ (Indicator)
Hello everyone! This is Yururi mo Yururi.
This time it is about “Gold/US Dollar,” shown in “Koropokkuru - Auto display of horizontal lines”Koropokkuru - Auto display of horizontal lines, and we wrote an article aboutchart analysis using horizontal lines.
We are also公開 (publishing) the parameter settings for the indicators used in the chart display,so anyone considering purchasing this indicator will find it useful,including those who have already purchased itfor reference,as well as those who have already bought it.
Chart analysis using horizontal lines
Chart data is used from “Golden Way Japan (FXTF).”
The indicator used is ‘Koropokkuru - Auto display of horizontal lines~’.
Also, the parameter settings used by each indicator are described in the chart results, so I would be grateful if you could refer to them.
<Basic information>
◎ Gold/US Dollar
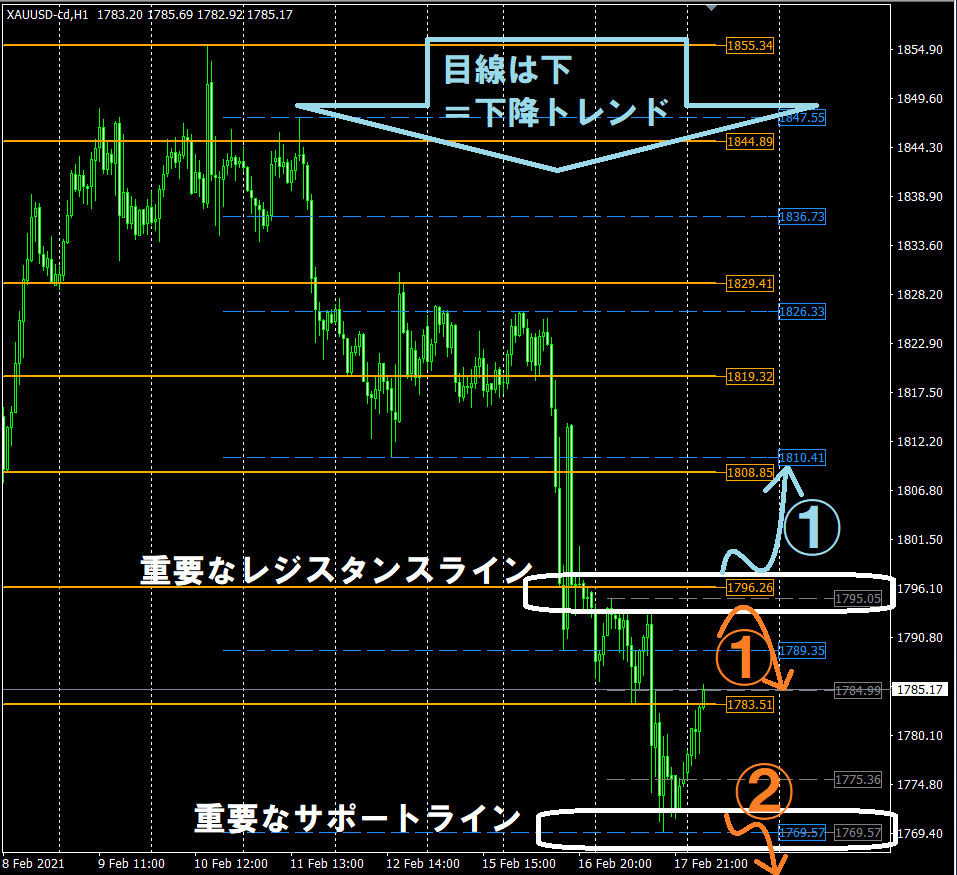
From the perspective of the chart environment on a long-term timeframe, the bias is downward (downtrend).
Important resistance line … 1796.26
Important support line … 1769.57
<Scenario>
Orange arrow ① … a scenario of “selling on rebounds” after failing to break above the important resistance line 1796.26.
Orange arrow ② … a “selling on rebounds” strategy after breaking below the important support line 1769.57 and awaiting a pullback (roll reversal).
Light blue arrow ① … a “buying on dips” strategy after breaking above the important resistance line 1796.26 and awaiting a pullback (roll reversal).
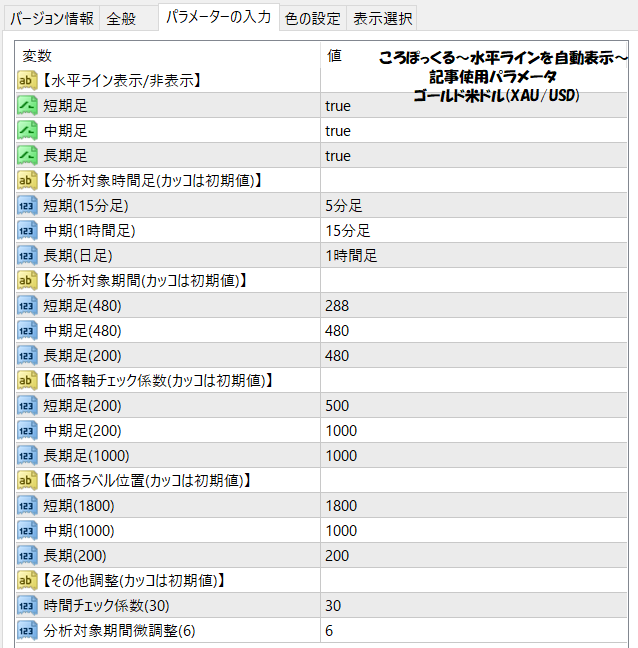
◎ Used parameters
▼ What is “Koropokkuru - Auto display of horizontal lines”
This indicator was created to automatically display horizontal lines and reduce trading burden. It aims to automatically display up to three optimal horizontal lines for each of multiple timeframes by analyzing the highest and lowest prices within a defined period by price band.
The horizontal lines in the image above are all automatically displayed!

◎ Recommended for
☆ FX traders - beginners to intermediate Those who have studied FX trading to some extent probably have drawn horizontal lines based on what they learned. In doing so, you may have had the following concerns: Have you ever felt・ Checking the market to draw horizontal lines takes time. ・ Drawing too many lines makes the chart hard to read. ・ You’re unsure if the lines you drew are correct. ・ You don’t know how long your drawn lines remain valid. ・ It’s difficult to judge take-profit and stop-loss points.
This indicator solves all of those concerns!
◎ Features
The indicator has the following features.○ Automatic display of horizontal lines ・Updates automatically to match the latest conditions. ・Horizontal lines update automatically. … In short, it saves the effort of drawing lines! ○ Adjustable display interval for horizontal lines ・Display frequency can be freely adjusted. ・If displayed less, the chart won’t look cluttered. … In short, you can customize to your liking! Furthermore, since the price of the horizontal lines is displayed, it makes discretionary trading easier!
◎ How to use
Very easy to use!Product introduction pageintroduces the usage in “3 patterns,” so please take a look!

◎ Summary
We also sell other products that help with trading!
<< [Set Sale] Koropokkuru - Angle is Delivering Series >>

We also analyze markets on our blog