

2/17 Horizontal Line Chart Analysis [GBPJPY] ★ Koropokuru ~ Automatically display horizontal lines ~ (Indicator)
Hello everyone! This is Yururi mo Yururi.
This time about the Pound/Yen, in “Koropokkuru ~ Automatic Horizontal Line Display ~” the chart analysis using horizontal lines that was displayedusing horizontal linesto article.
We have also公開 the parameter settings for the indicators used in the chart display,so if you are considering purchasing this indicator, of course, those who have already purchased can also refer to it.I thinkthis will be helpful for you.
Chart analysis using horizontal lines
Chart data is provided by “Golden World Japan (FXTF)”.
The used indicator is 『Koropokkuru ~ Automatic horizontal line display~’.
Additionally, the parameter settings used by each indicator are described in the chart results, so we would be grateful if you could refer to them.
<Basic Information>
◎ Pound/Yen
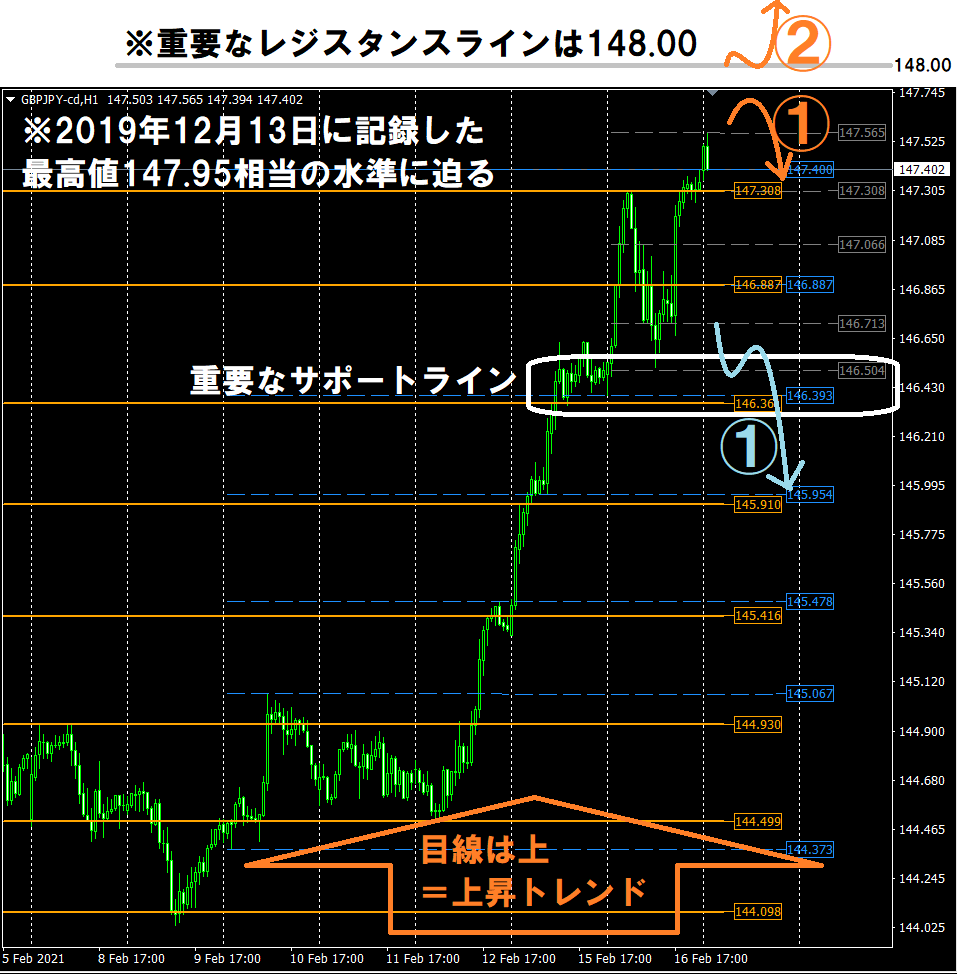
From the long-term timeframe chart environment, the view is upward (uptrend continuing).
Key resistance line ... 148.00
Key support line ... 146.50~146.36
<Scenario assumed>
Orange Arrow ① ... a scenario of “selling on a pullback” after failing to break above the important resistance line 148.00
Orange Arrow ② ... a scenario of “buying on the dips” (pullback) after breaking above the important resistance line 148.00
Light blue Arrow ① ... if selling pressure is confirmed (e.g., sharp drop), a scenario of selling on the pullback after breaking below the important support line 146.50~146.36 (roll reversal)
◎ Used Parameters
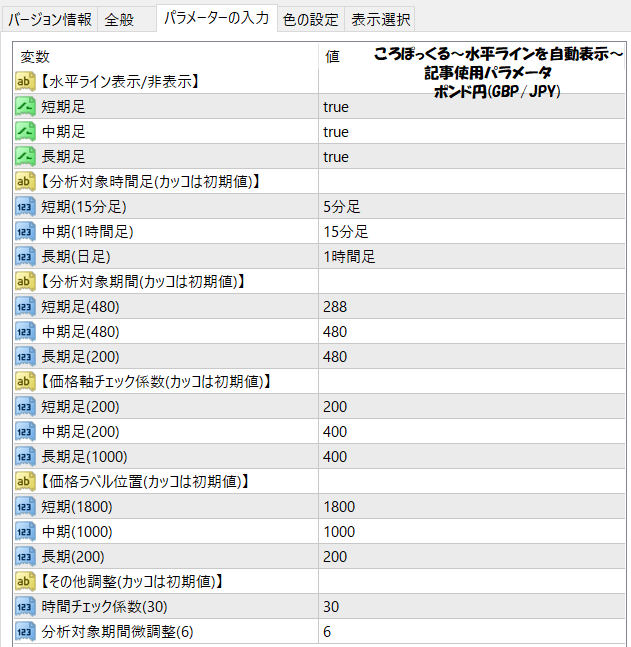
▼ What is “Koropokkuru ~ Automatic horizontal line display ~”
This indicator was created to automatically display horizontal lines to reduce trading burden.
It analyzes the highest and lowest within a set period by price ranges and automatically displays up to three optimal horizontal lines on each of multiple timeframes.

◎ Suitable for
☆ FX traders from beginner to intermediateThose who have studied FX trading to some extent have probably drawn horizontal lines to apply learned knowledge. In doing so, they may have had the following concerns・ It takes time to check the market to draw horizontal lines.
・ Drawing too many horizontal lines makes the chart cluttered.
・ Not sure if the horizontal line you drew is correct.
・ Not sure how long the horizontal line you drew remains valid.
・ Difficulty determining take-profit and stop-loss points.
This indicator solves all those concerns!
◎ Features
This indicator has the following features.○ Automatic display of horizontal lines ・Automatically displays according to the latest conditions. ・Horizontal lines are updated automatically. ... in short, it saves you the trouble of drawing lines! ○ Adjustable display interval for horizontal lines ・Display frequency can be freely adjusted. ・If shown less, the chart won’t look cluttered. ... in other words, you can customize as you like! Furthermore, the price of the horizontal lines is displayed, making discretionary trading easier!
◎ How to use
How to use is very simple!Product Introduction Page introdu ces three patterns, so please take a look!

◎ Summary
We also sell other products useful for trading!
<< [Set Sale] Koropokkuru ~ The Angle is Life Series ~ >>

We also analyze markets on the blog