

2/16 Horizontal Line Chart Analysis [EUR/USD] ★ Koropokuru ~ Automatic Horizontal Line Display ~ (Indicator)
Hello everyone! This is Yururi-mo Yururi.
Thank you very much for reading this article.
This time, about the Euro/Dollar, we display with “Koropokkuru – Automatic Horizontal Line Display” and have written an article onchart analysis using horizontal lines.
We have also published the parameter settings for the indicators used in the chart display,so those considering purchasing this indicator, of course, and those who have already purchased, can参考find it useful as well...
Chart analysis using horizontal lines
Chart data is sourced from Goldene Way Japan (FXTF).
The used indicator is『Koropokkuru – Automatic Horizontal Line Display~’.
Also, the parameter settings used by each indicator are described in the chart results, so we would be grateful if you could参考.
<Basic information>
◎ Euro/Dollar
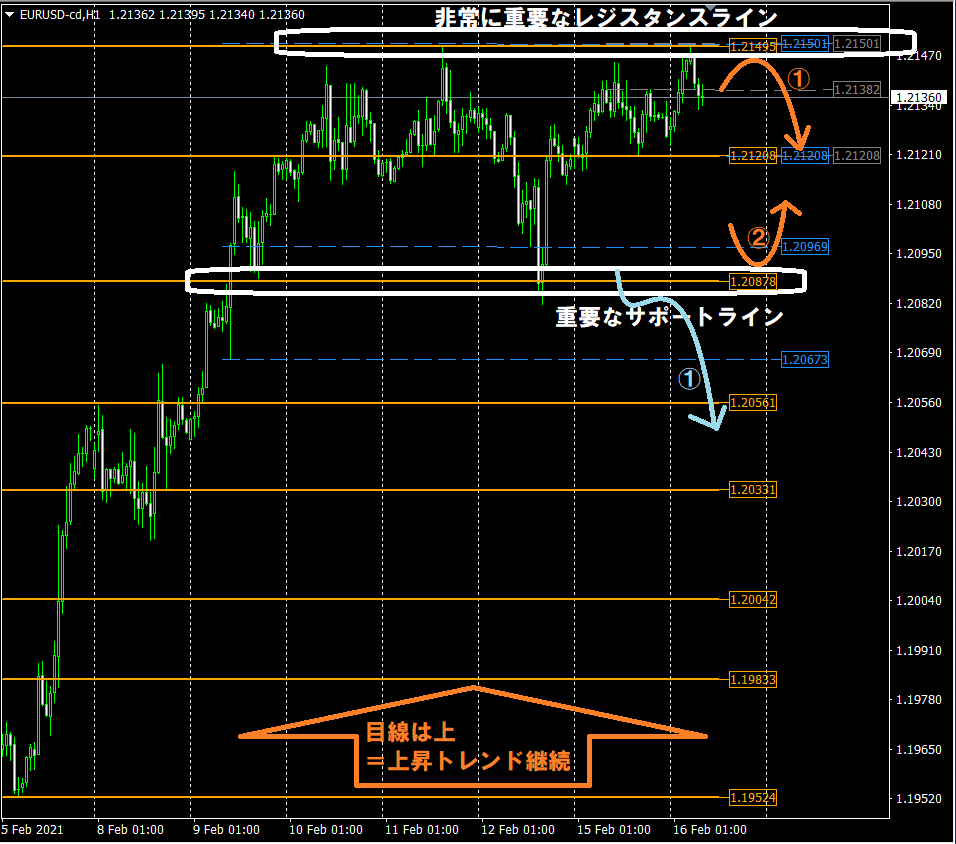
From the long-term timeframe chart environment, the outlook is up (uptrend continues).
Important resistance line … 1.2150
Important support line … 1.2087
<Possible scenarios>
Orange Arrow ① … scenario of “selling on bounces” where price cannot break above the important resistance line 1.2150 and falls back
Orange Arrow ② … scenario of “buying on dips” where it initially falls but rebounds at the important support line 1.2087
Light blue Arrow ① … scenario of “selling on rallies” after the decline continues and breaks below the important support line 1.2087, aiming for a rebound
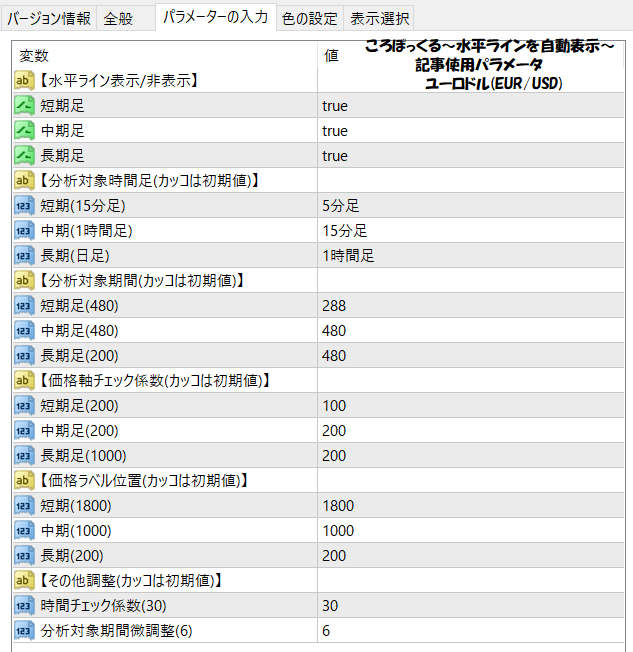
◎ Used parameters
▼ What is “Koropokkuru – Automatic Horizontal Line Display”
This indicator was created to automatically display horizontal lines and reduce trading burden. It aims to automatically display horizontal lines by analyzing the highest and lowest prices within the set period, displaying up to three optimal horizontal lines on each of multiple timeframes.
The horizontal lines in the image above are all displayed automatically!

◎ Recommended for
☆ FX traders from beginner to intermediate Those who have studied FX trading to some extent probably have drawn horizontal lines by applying their knowledge. In doing so, have you ever had the following concerns?・ It takes a long time to check the market to draw horizontal lines.
・ Drawing too many horizontal lines makes the chart hard to read.
・ I’m unsure whether the horizontal lines I drew are correct.
・ I don’t know how long the horizontal lines I drew will remain valid.
・ Difficulty in judging take-profit and stop-loss points.
This indicator solves all those problems!
◎ Features
The indicator has the following features.○ Automatic display of horizontal lines ・Automatically displays according to the latest situation. ・Horizontal lines update automatically. … so you save the effort of drawing lines! ○ Adjustable display interval for horizontal lines ・Display frequency can be freely adjusted. ・If displayed less, the chart won’t be hard to read. … in short, you can customize to your liking! Furthermore… the horizontal line prices are displayed, making discretionary trading easier!
◎ How to use
The usage is very simple!Product introduction pageexplains the usage in “3 patterns,” so please take a look!
<<Product introduction page is here, please click>>
https://www.gogojungle.co.jp/tools/indicators/18694

◎ Summary
We also have other trading aids for sale!
<<【Set Bundle】Koropokkuru – Angle is King Series~>>>

We also analyze markets on the blog