Explain how to read candlesticks on the FX chart! You can win with just candlesticks!
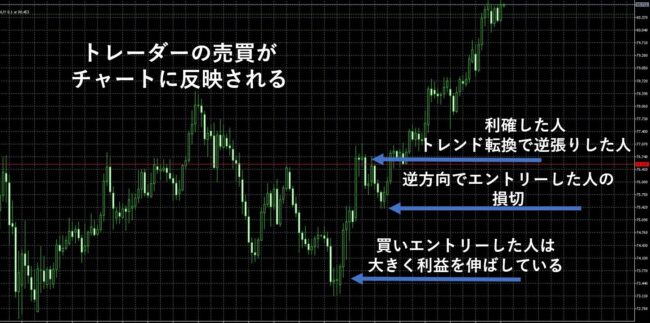
How to Analyze FX Markets Using Candlestick Charts
As you master candlestick analysis, you will be able to read the movements of the FX market.
Here, we will explain the points indicated by the shapes of candlesticks.
A Doji Indicates Balance Between Selling and Buying Pressure
A candlestick with a short body and wicks on both ends resembles a cross, indicating balanced selling and buying pressures and a situation of indecision.
The flow is likely at a peak, and whether it appears during an uptrend or a downtrend, candlestick patterns of this type suggest that the current flow could reverse.
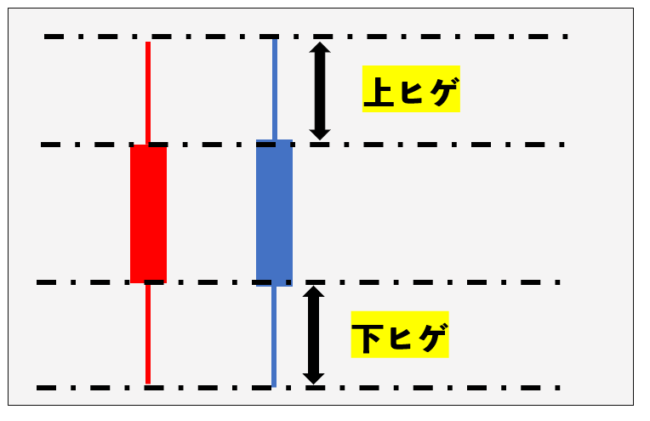
Candlesticks with Long Upper Wicks Suggest a Shift Toward Selling Pressure
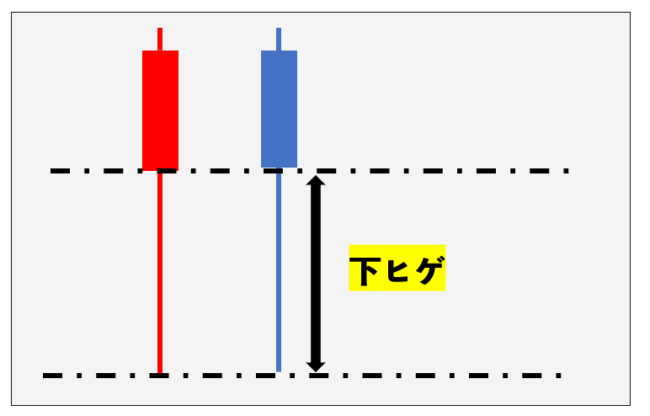
When the lower wick is long, it shows that selling pressure pushed the price down to new lows, but buying resistance was strong enough to push the price back up.
The longer the wick, the stronger the buying resistance, making a reversal to buying more likely.
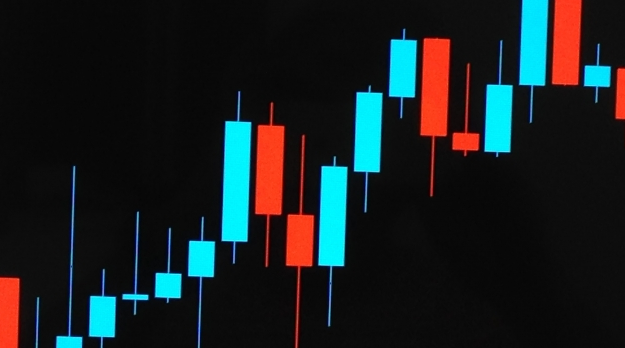
Candlesticks with No Wicks: Major Bullish and Bearish Candles as Trend Signals
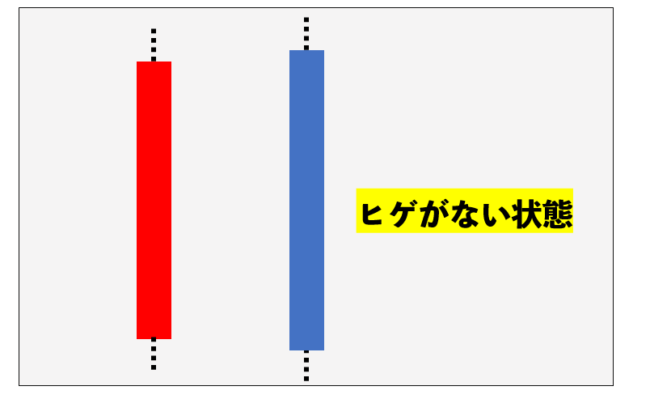
A bullish candle with no upper or lower wicks and a large body is called a “large bullish candle.”
From the open, the price does not fall below the open; the open becomes the low, and the high does not exceed the high, with the close at the high, showing no wicks above or below.
The absence of upper and lower wicks indicates that buying is pushing strongly in one direction, suggesting continued buying momentum.
Similarly, a bearish candle with no wicks, called a “large bearish candle,” moves contrary to a large bullish candle, and suggests continued selling momentum.
Profit-taking Timing Is Also Predictable, So Recommended
Additionally, by observing three candlesticks in a sequence, you can read the market flow and time profit-taking accordingly.
If three consecutive daily candles are bullish, prices have risen for three days, indicating an “upward flow.” Conversely, if three consecutive daily candles are bearish, prices have fallen for three days, indicating a “downward flow.”
If this upward flow occurs twice and then a downward flow appears, you can anticipate that prices may continue to drop for a while.
For more details, please refer to my site as well.
A Beginner-Friendly Explanation of How to Read Candlesticks on FX Charts