

Indicator Total_method Market Analysis USDCAD 1/20
Total_metho’s fibo square for visually understandable market analysis
fibo square... since it’s usually long and hard to use, a simplified versionkind-boxwill be used from now on with this name.
If you look closely at this kind-box, you can see various market conditions.
This kind-box as the main feature of Total_Method’sexplanation pageandsales page
Immediately, the 1-hour chart of USDCAD as seen on 1/20
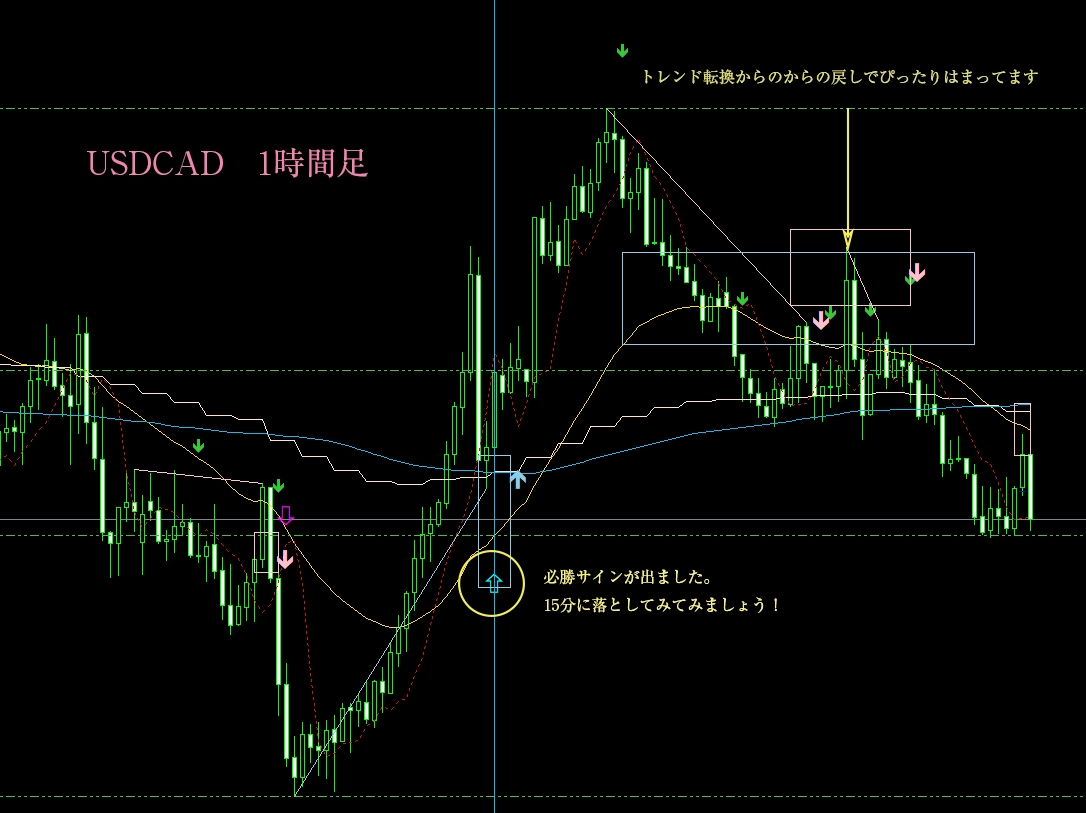
What is a sure-fire signal? It is a signal that appears when the kind-box emerges and a consciousness-form that focuses on the 38.2 line appears.
Of course, even if it doesn’t appear, it doesn’t change the pullback point.
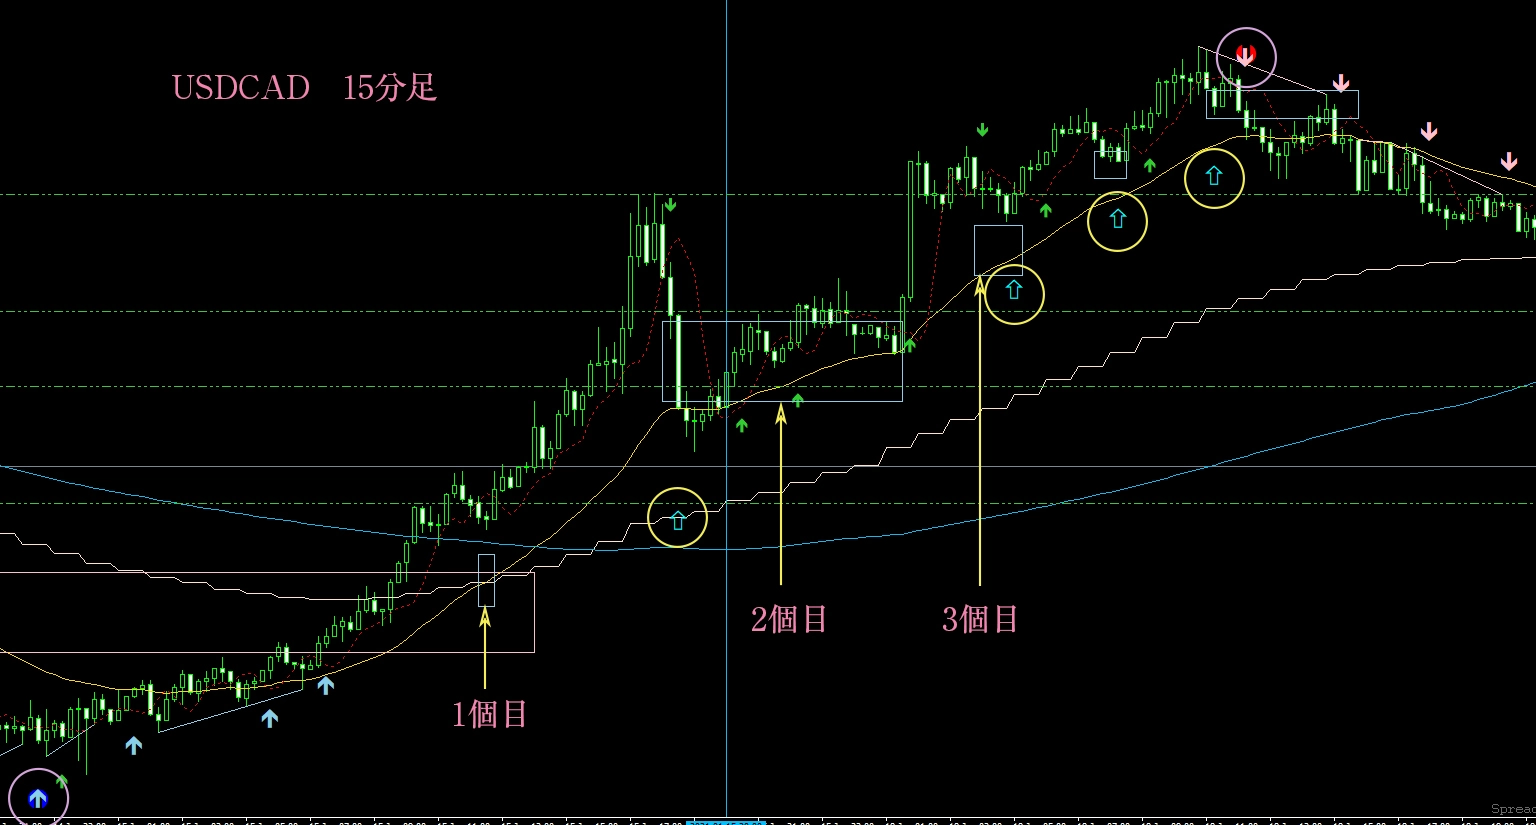
15-minute chart (blue vertical line drawn for clarity)
By the way, the red dotted line is DMA3×3, yellow is the 15-minute MA, the jagged light orange lines are the 1-hour MA, and the blue line is the 15-minute 200 MA.
The sign encircled in light pink at the bottom left isthe reverse-trend double-repo method signal and the rising signaloverlapping, and it has crossed the 15-minute and 1-hour MAs, and the pink kind-box as well
indicating that a trend reversal on the 15-minute chart is coming.
Within this uptrend,the blue kind-box appears five times,the sure-fire signals (circled in yellow) are fourappearing.
Since Elliott Wave’s up move is three waves, it might be better to refrain from entering at the last two blue kind-box points.
In this way, using the kind-box makes it visually easy to grasp the trend.
Next, above, the reverse-trend double-repo and the lower-slope signal appear overlapped.
The blue kind-box breaks below and returns to the 38.2 line (the upper edge of the blue kind-box) and rebounds, and the 15-minute MA also breaks down, indicating a downward move.
A 15-minute trend reversal occurs, signaling the start of a downtrend.
The situation is exactly the same as the rising phase.
Sorry for the long analysis, but
the area where the blue vertical line is seen on the 1-hour chart has the blue kind-box on the 15-minute chart as well, and it rebounded at the 61.8 line, making it an excellent entry point.
The next place where a sure-fire signal appears is also a possible entry point.
I believe this indicator makes market analysis very easy to understand.
× ![]()