
Market status of Indicator Total_method 2021/01/16
Sales Page
We prepared 4 images in 3 patterns.
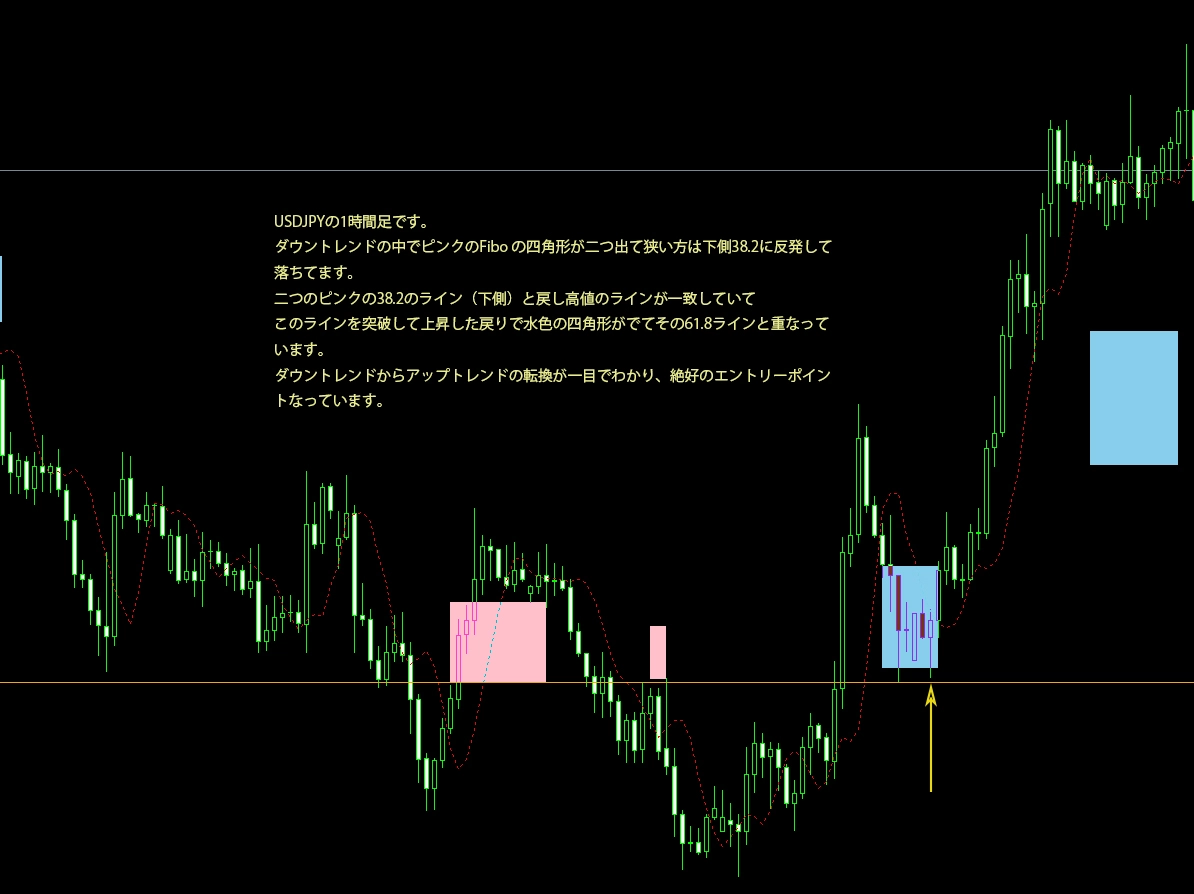
The fibo 38.2 and 61.8 lines are represented by pink and light blue rectangles.
Also, these rectangles were not drawn afterward;they were drawn earlier(so it is easy to think they were added later because the price reacts so much to these rectangles).
This is a situational analysis of an indicator that catches the trend pushbacks and retracements with the fibo 38.2 and 61.8 lines rectangles.
The 38.2 and 61.8 lines of the Fibonacci retracement, known as leading indicators, are indeed highly acknowledged.
Entry points are considered where the price rebounds from the rectangles, but
these three images are prepared to especially show market turning points.
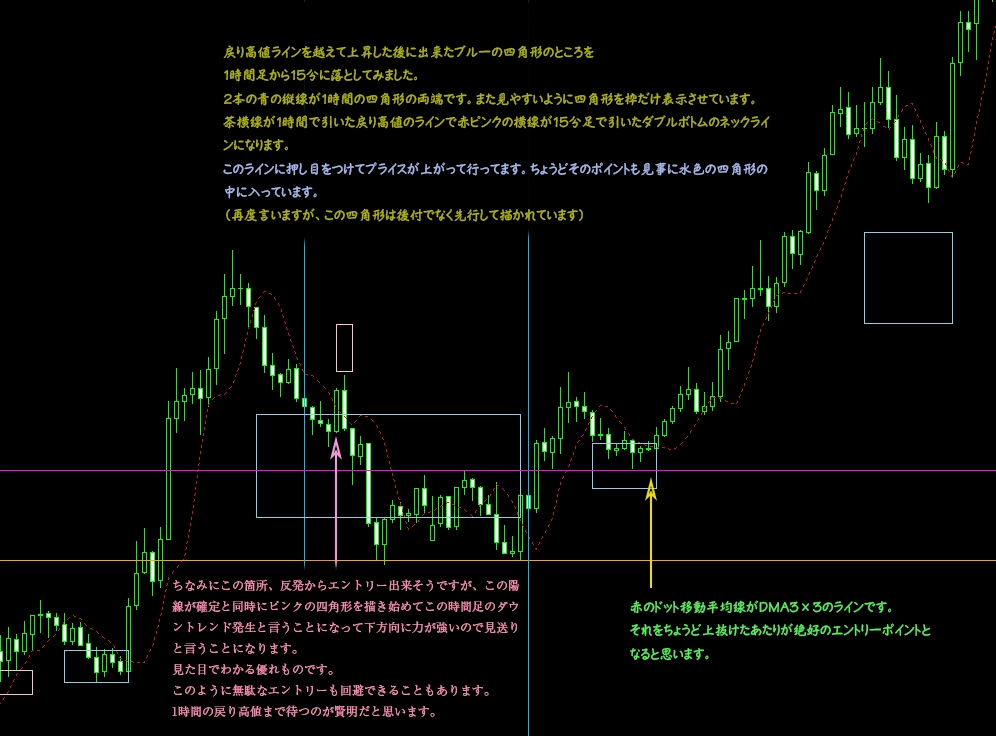
(The bottom image is shown with the high-to-low line sign as the situation)
Let's drop the yellow-arrowed area to a 15-minute chart to look for clearer entry points
The image below is the 15-minute version. For clarity, the rectangles are shown only as borders.
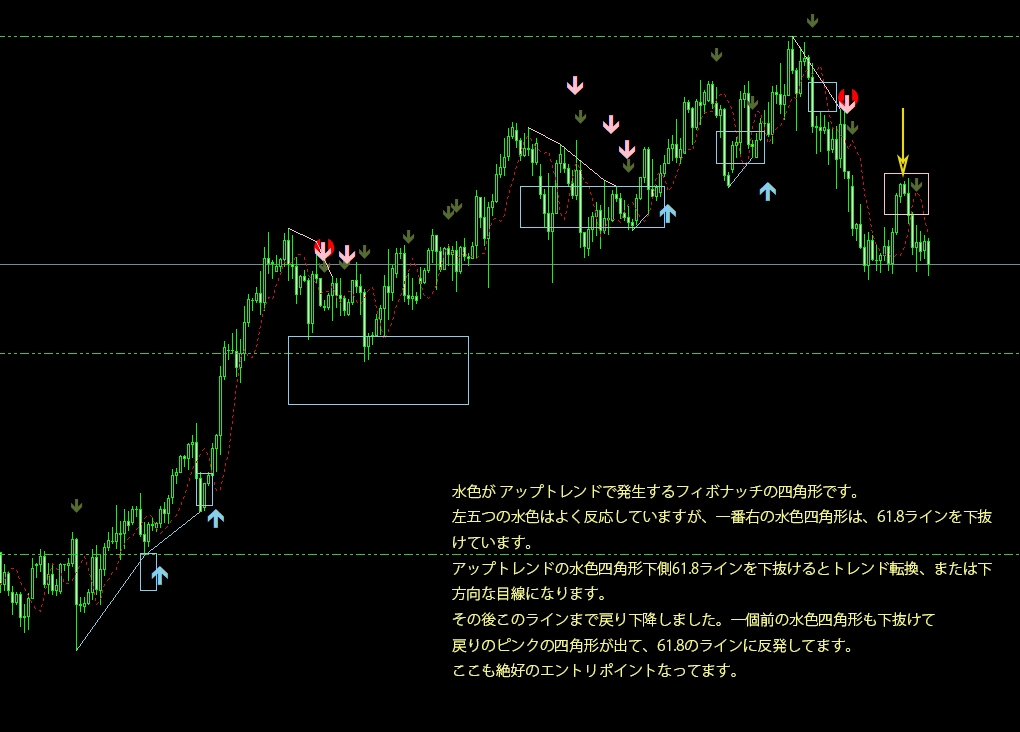
Second image below, Pattern 2
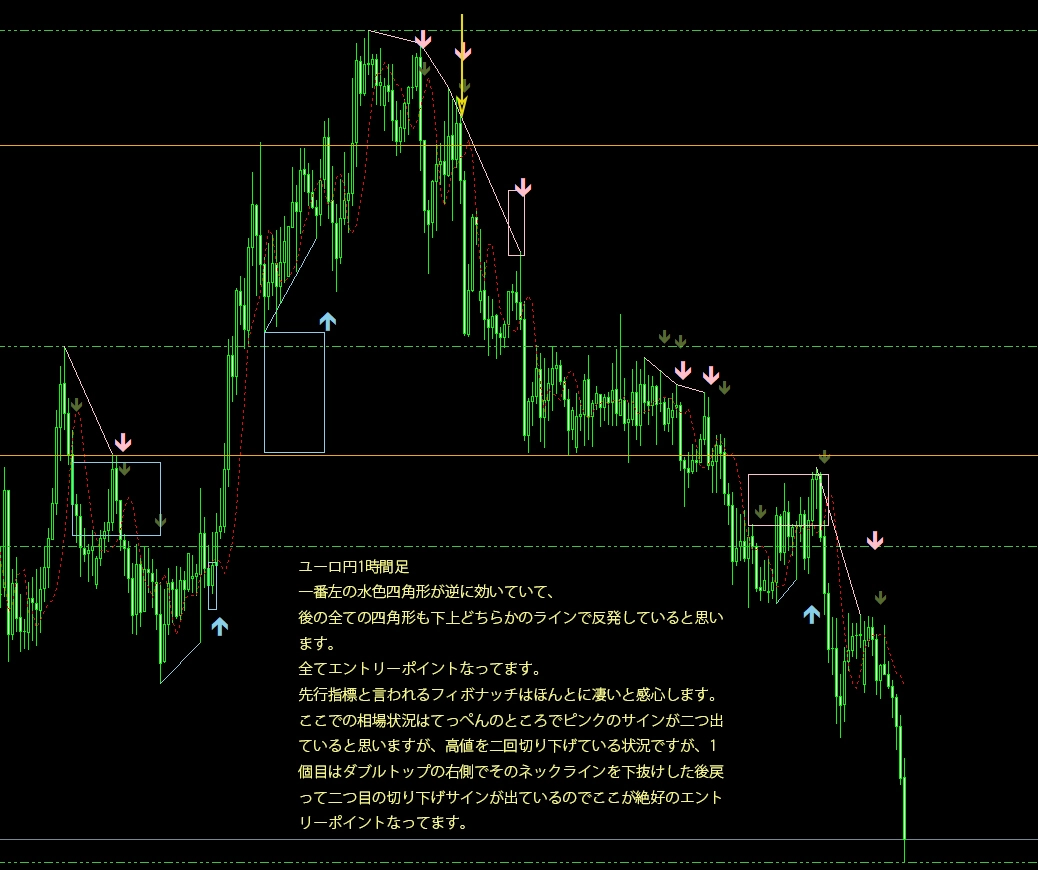
Third image below, Pattern 3