

Even just crossing and touching the moving average line can yield profits!
The following chart shows the USD/JPY 5-minute and 1-minute charts for the same time period(Click the chart to enlarge)。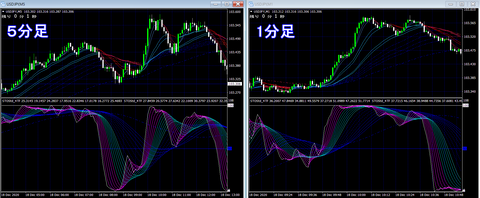
USDJPY 1-minute(Chart click to enlarge)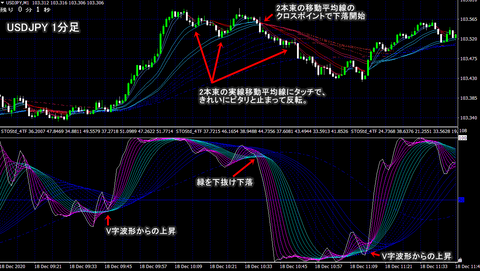
When the two adjacent simple moving averages touch, they neatly halt and reverse, as you can see.
Also, the downtrend starts at the crossover point of the two adjacent moving averages.
USDJPY 5-minute(Chart click to enlarge)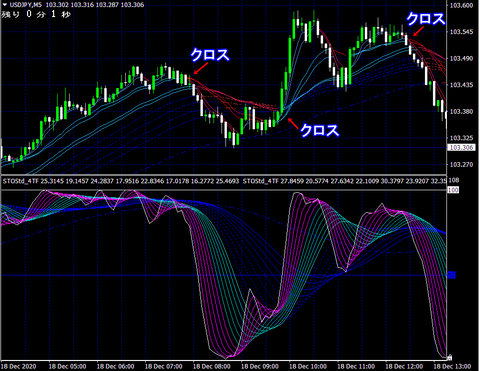
In the 5-minute chart, the crossover point of the two moving averages is a classic turning point.
The chart (market) is a living creature, so not every crossover point is a turning point. However, when the lines form this kind of shape, do not miss it and “select and focus on that area to place trades, which is the key to making substantial profits in trading.
Mebius Moving Average Characteristics
「Converge」 and「Diverge」 repeatedly.


In FX, the concept of chart “time adjustment” is very important.
Since this time adjustment concept is built into the settings,
the timing becomes very easy to understand.
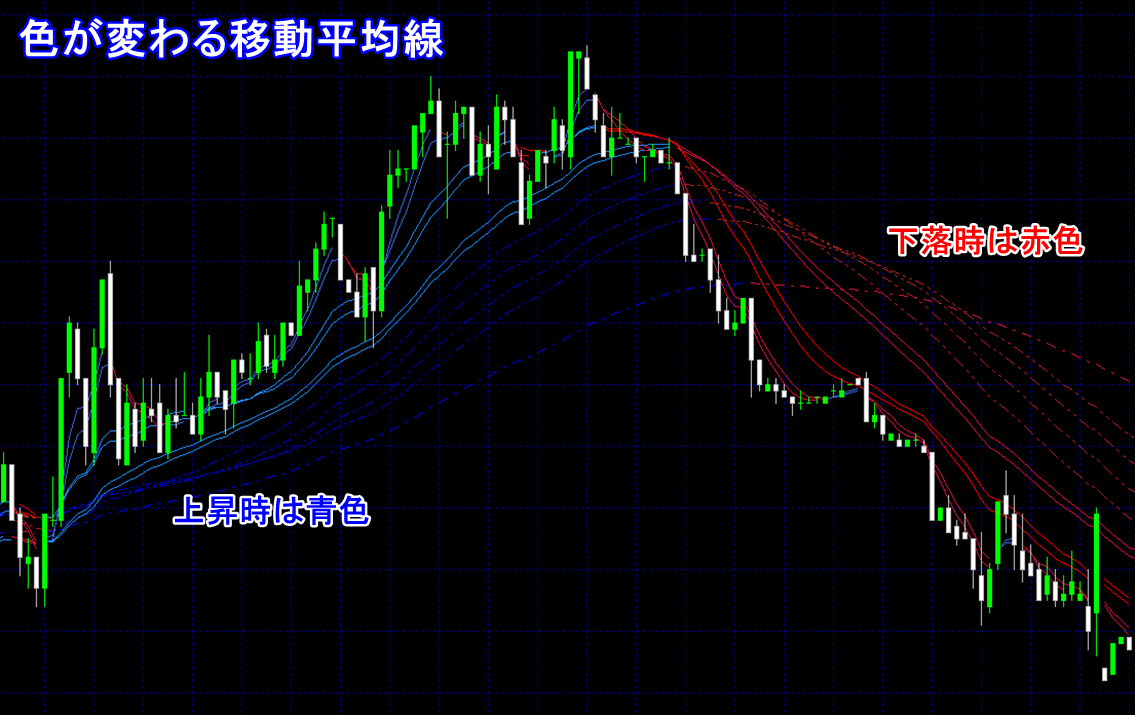
When risingblue and when fallingred, making it obvious at a glance whether the current market is up or down.


if you touch the middle two solid lines or the third pair of two solid lines,b seaentry opportunities.
At this time, as a cautionary measure, an alert sound will play to indicate the touch.

This moving average template's
GoGoJungle product page is here ⇒https://www.gogojungle.co.jp/tools/indicators/26502


