

Weekly Trade Strategy 1130~
Thank you for subscribing as always.
To trade with high accuracy, multi-timeframe chart analysis is essential.
The analysis I have developed over more than 15 years in FX is a simple, multi-timeframe chart analysis using moving averages and MACD.
The Daily Trading Strategy is mainly information for day trading, and for the three timeframes of daily, weekly, and monthly,
we create a trend table and describe that day's strategy (long, short, or wait-and-see), so the strategy is clear at a glance.
Analysis
FX: USD/JPY, EUR/USD, EUR/JPY, GBP/USD, GBP/JPY, AUD/JPY
CFD: Gold (XAU/USD) ● USD/JPY daily
・Analysis and Strategy
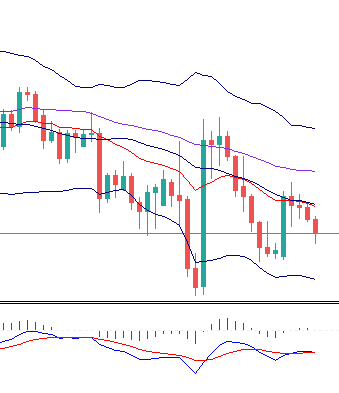
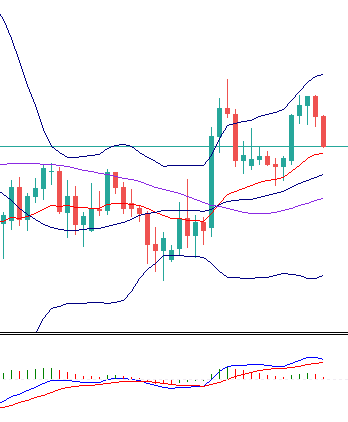
On the daily chart, the price has closed below the SMA25, but the MACD is still above the signal.
The lows are rising and the highs are falling, giving a sort of symmetrical triangle consolidation. The focus is which way it will break. If MACD crosses down (DC), movement to the downside is likely. Both weekly and monthly timeframes are signaling downside, so the pattern continues to look for pullback selling opportunities. Upward resistance on the daily chart is in the order of SMA25, SMA50, and weekly EMA20.
●EUR/USD
・Analysis and Strategy
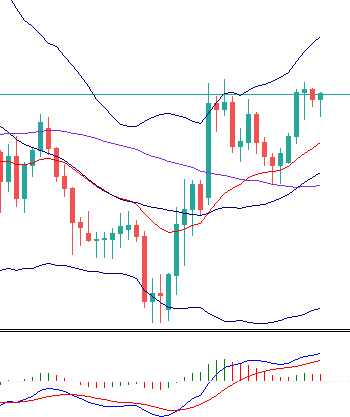
The daily chart shows SMA25 rising and an uptrend beginning to take shape. There appears to be persistent resistance around 1.19–1.20, keeping the upside somewhat heavy; if it exceeds 1.201, there is potential for a rush to 1.25. The weekly Bollinger Band is contracting, so the next trend direction is to be determined. If the daily price falls below SMA25, a move toward 1.16 could occur. Currently, we will use a buy-the-dip approach with small profit-taking, and once we break above 1.201, we would like to hold long.
●EUR/JPY
・Analysis and Strategy
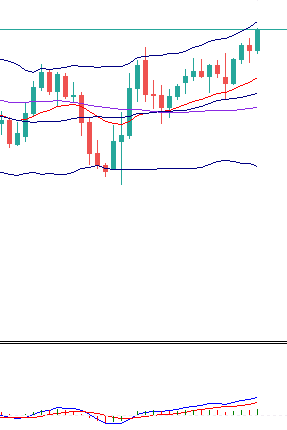
The daily chart remains above SMA25, showing a bullish stance. Last weekend’s decline was followed by a quick recovery. If it breaks above 125.1, an uptrend will be confirmed. As long as price stays above daily SMA25, buy on dips. If it falls below, it could head back toward 121 yen.
●GBP/USD
・Analysis and Strategy
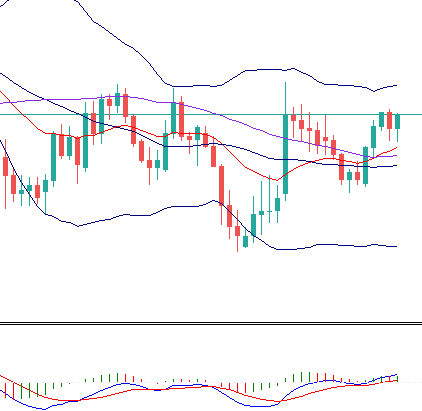
The daily chart remains above SMA25 with an ongoing uptrend, but it faced an early retreat near resistance at 1.34–1.35 and closed lower. If retreats continue, there is a possibility of dropping toward the daily EMA20-SMA25 vicinity. We will look for buys on dips, but if the daily MACD crosses down, a ceiling around 1.34–1.35 could be confirmed.
●GBP/JPY
・Analysis and Strategy
The daily chart has not been able to clear resistance near 140 yen and has retreated again. First, it is expected to fall to the support zone of daily EMA20-SMA25, where the key is whether it holds. If supported, a move higher is anticipated. The dip buying is favored, but similar to GBPUSD, if the MACD turns down (DC), a top may have formed, so it’s necessary to monitor chart movement.
●AUD/JPY
・Analysis and Strategy
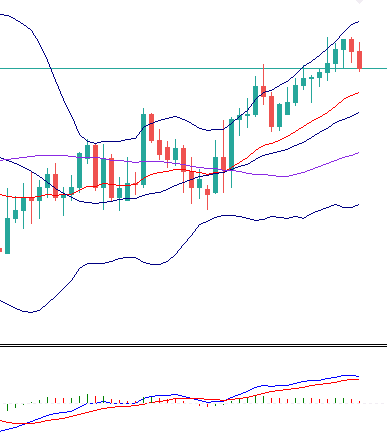
On the daily chart, it has rebounded with the EMA20 rising, and the price remains clearly above EMA20-SMA25. If price breaks above the 77 yen resistance, an uptrend could begin, with potential to rise toward around 78.5 yen. We will attempt to buy on dips and, if a trend emerges, hold the position firmly.
●XAU/USD(GOLD)
・Analysis and Strategy
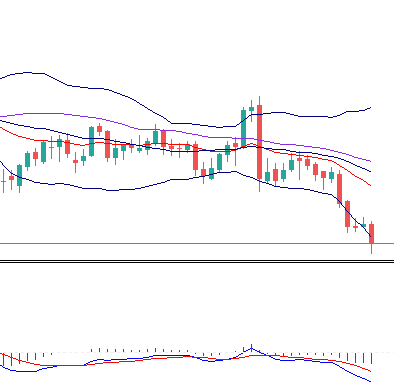
Weekly SMA25 is under the price and the daily chart has entered a downtrend. The downside target is near the weekly SMA50 around 1750 dollars. Shorts should be kept.
4h: 4-hour chart (8h, 12h are the same)
SMA: 25-day simple moving average
EMA20: 20-day exponential moving average
BB: Bollinger Bands (period 25)
ADX: A technical indicator showing the strength of the trend. If rising, there is a trend; if falling, there is no trend (range). (Period 14)
GC, DC: MACD performing a Golden Cross (GC) or Dead Cross (DC)