

Weekly FX Trade Strategy 1123~
Thank you for your continued subscription.
This is the weekly trend table and trading strategy based on daily data.
The weekly trading strategy creates trend tables for three timeframes: daily, weekly, and monthly.
Primarily aimed at swing trading information.
Charts change daily, so please refer to this together with the daily trading strategy.
Analysis
FX: USD/JPY, EUR/USD, EUR/JPY, GBP/USD, GBP/JPY, AUD/JPY
CFD: Gold (XAU/USD)
● USD/JPY Daily
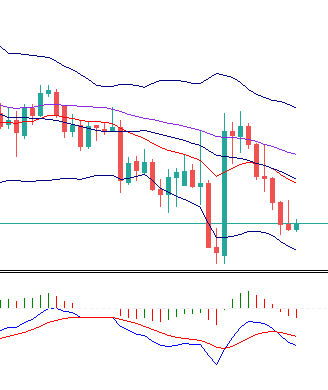
Analysis and Strategy
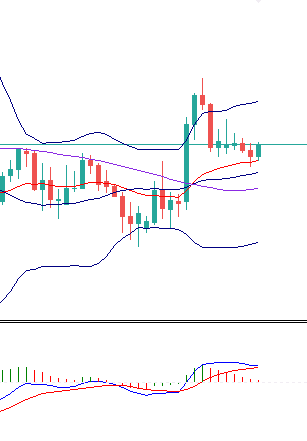
Daily: closes below SMA25, MACD is also bearish with a dead cross. If it continues to break below 103 yen toward targets such as 101, 99, a downside move is expected. Weekly and monthly charts are also moving downward below SMA25, so a substantial downside breakout is anticipated. This week, the basic strategy is to look for selling rallies as a shorting opportunity.
● Euro Dollar
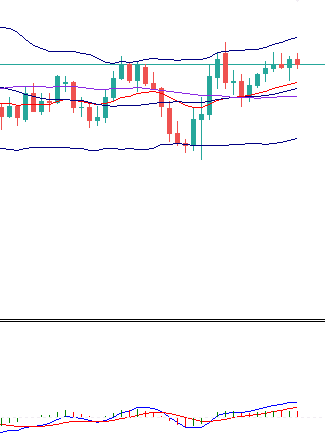
Analysis and Strategy
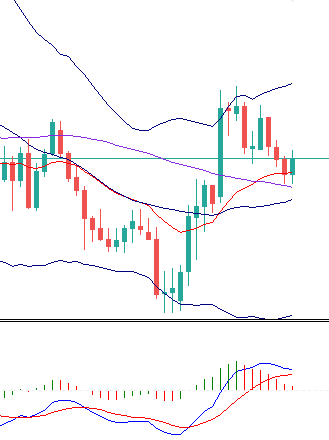
Daily: Recovery above SMA25, indicating continuing upside movement. There appears to be intermittent resistance around 1.19-1.20, keeping upside pressure heavy. The weekly Bollinger Band is contracting, suggesting the 1.16-1.20 range is nearing the end. The next development will be to determine which direction the range will break.
This week, as long as the daily price stays above SMA25, we will maintain an upside-oriented strategy.
● Euro Yen
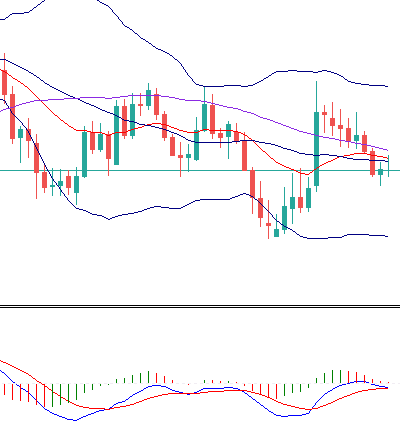
Analysis and Strategy
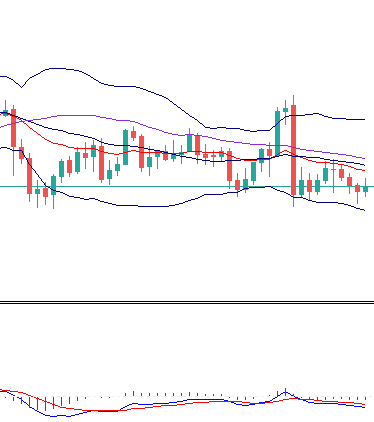
Daily: Bearish momentum remains since it is below SMA25, but MACD is above its signal line. If MACD forms a dead cross, it may move further downward. Weekly closes slightly below SMA25 while weekly SMA25 is rising, so the upside pressure for this week is expected to remain heavy. The daily chart is somewhat unclear, but as long as it stays below SMA25, the basic strategy will be to short.
● Pound Dollar
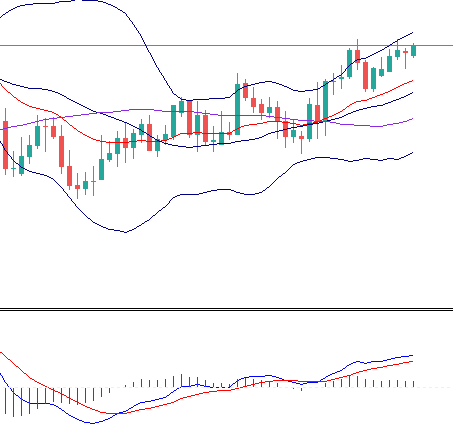
Analysis and Strategy
Daily: Price above SMA25 with SMA25 rising, entering an uptrend. 1.33 acts as resistance; if it breaks above 1.33, it is likely to test higher around 1.35. Weekly and monthly remain bullish, so we want to stay long.
● Pound Yen
Analysis and Strategy
Daily: Price is firmly rebounding above EMA20, and if it can defend the EMA20-SMA25 line, there is a high likelihood of testing 140 again, making long the basic strategy. However, since a bottom is not yet confirmed, if it falls below daily SMA25, switch from long to short. Since EUR/JPY is below SMA25, it is uncertain whether GBP/JPY will find support here.
● AUD/JPY
Analysis and Strategy
Daily: Similar to GBP/JPY. Price is rebounding above EMA20, and if it holds the EMA20-SMA25 line, there is a high likelihood of testing 77 again, so long is the basic strategy. However, as a bottom is not confirmed, if it dips below daily SMA25, switch to short.
● Gold
Analysis and Strategy
Daily: Range-bound. Around 1855 there is weekly SMA25; if it breaks below this, a significant downtrend could begin.
However, currently there is no break of the range. If the daily price breaks above SMA25, downside risk decreases, and a move toward 2000 is more likely as price steadies.
□ Glossary
4h: 4-hour chart (8h and 12h are the same)
SMA: 25-day simple moving average
EMA20: 20-day exponential moving average
BB: Bollinger Bands (period of 25 days)
ADX: Technical indicator showing trend strength. If rising, trend is present; if falling, trend is absent (sideways). (Period used: 14 days)
GC, DC: MACD Golden Cross (GC) and Dead Cross (DC)