
Simple FX Trading Strategy Using Moving Average and MACD (11/16)
Thank you for subscribing as always.
To trade with high accuracy, multi-timeframe chart analysis is essential.
The analysis I have honed over more than 15 years in FX is a simple multi-timeframe chart analysis using moving averages and MACD.
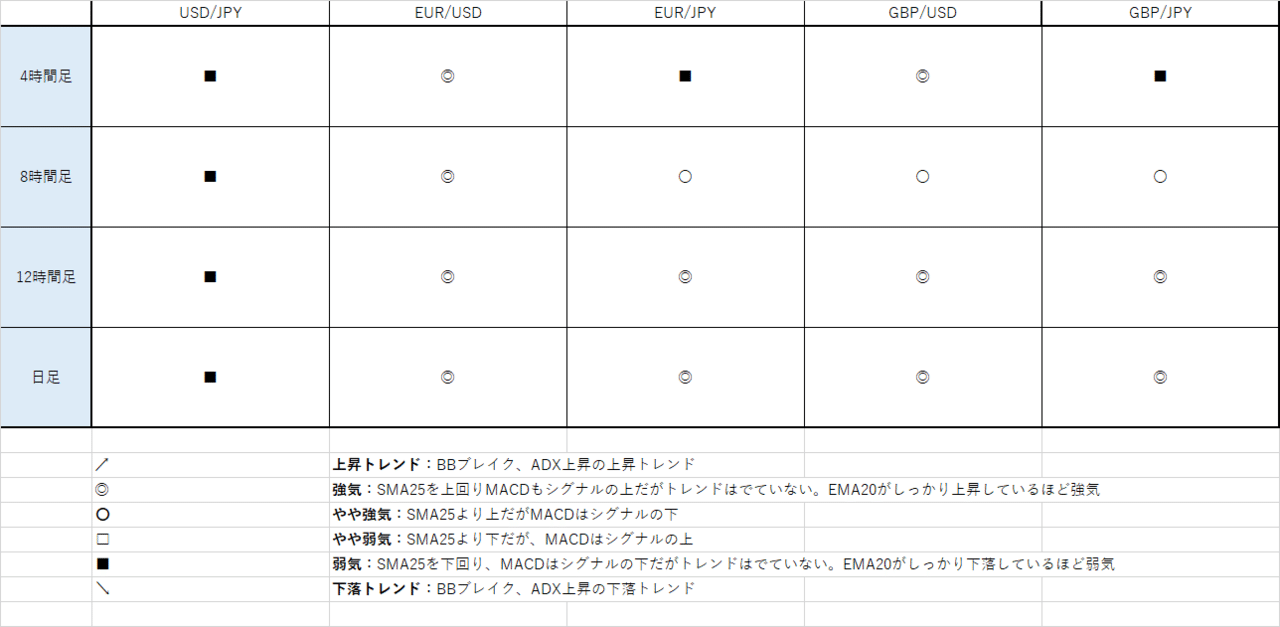
The Daily Trade Strategy is primarily information for day trading, and for four time frames—4-hour, 8-hour, 12-hour, and daily—
we create a trend table and record that day's strategy (long, short, or wait), making the strategy easily understandable at a glance.
Analysis currencies
FX: USD/JPY, EUR/USD, EUR/JPY, GBP/USD, GBP/JPY
• Trend table
• USD/JPY 4-hour
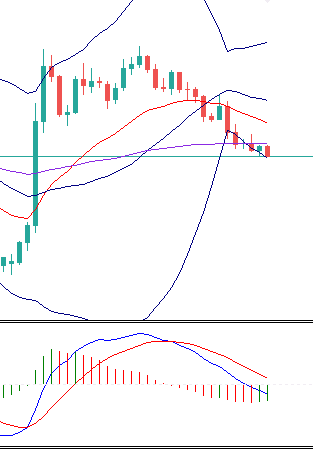
Analysis and strategy
We closed below the daily SMA25. As of this morning, the 12-hour SMA25 had been stopping the decline, and there was a slim chance of turning upward again, but the 12-hour SMA25 is also starting to fall below.
The 4-hour is also entering a downtrend, so strategically we should be short. However, if you look at the 8-hour and 12-hour charts, the Bollinger Bands remain expanded and the chart has not fully collapsed, making it hard to predict the moves, so we will stay on the sidelines until the chart stabilizes a little more.
• EUR/USD