

Weekly Trade Strategy 1115~
Thank you for subscribing as always.
To trade with high accuracy, multi-timeframe chart analysis is essential.
The analysis I have developed over more than 15 years in FX is a simple, multi-timeframe chart analysis using moving averages and MACD.
The Daily Trading Strategy is mainly information for day trading, and for the three timeframes of daily, weekly, and monthly charts,
we create a trend table and describe that day's strategy (long, short, or wait-and-see), so the strategy is easy to understand at a glance.
Analysis
FX: USD/JPY, EUR/USD, EUR/JPY, GBP/USD, GBP/JPY, AUD/JPY
CFD: Gold (XAU/USD)
● USD/JPY Daily
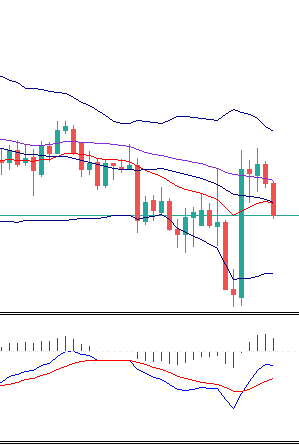
・Analysis and Strategy
The daily chart closed below SMA25. It is necessary to determine whether it will continue to drift downward below SMA25 or move back above SMA25 on the daily chart.
On the upside, the 105.6-106 yen area around the weekly EMA20-SMA25 serves as a major resistance.
On the downside, a support at 103 yen has formed, but judging from the chart, it does not appear to break through sharply, so trading is expected to remain in the 103-106 range this week. Near 106 yen, we will try shorts.
For EUR/JPY, EUR/USD, GBP/USD, GBP/JPY, AUD/JPY, and GOLD, please purchase the articles.