【Indicator Introduction】Oversold and overbought are obvious at a glance! "Superb RSI Dashboard"
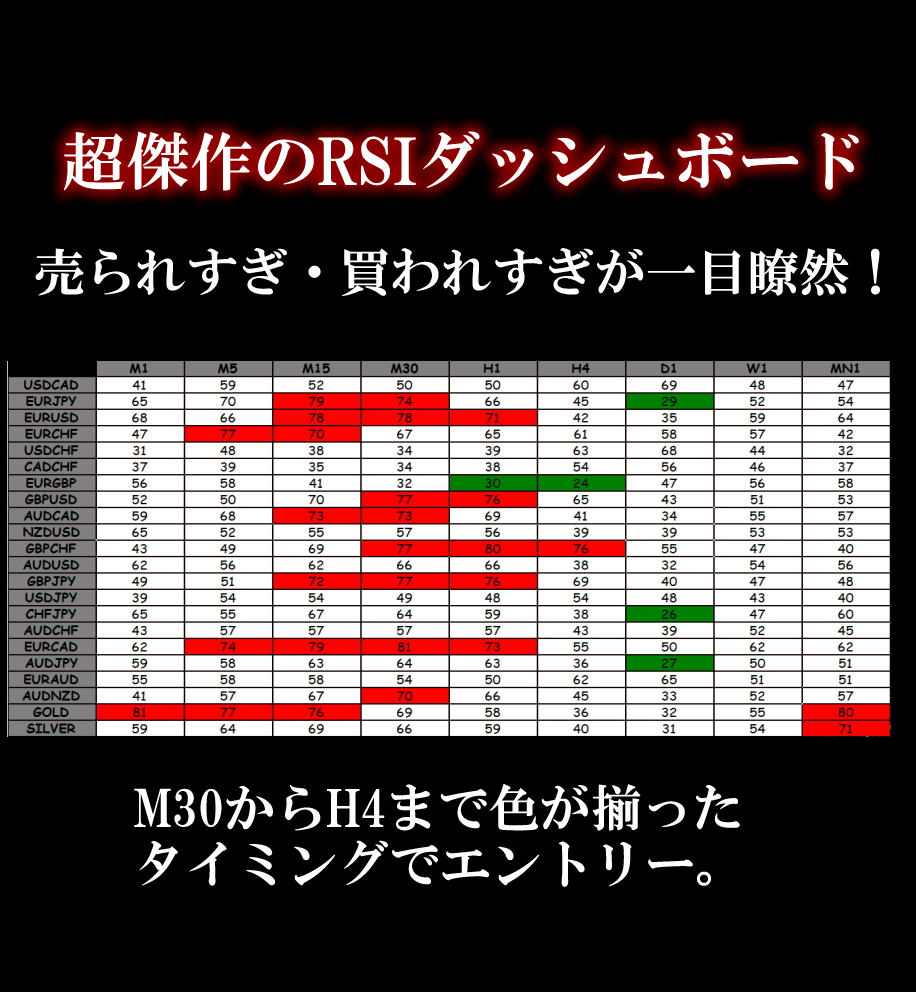
Oversold and overbought are clearly visible at a glance! Introducing the 'Superb RSI Dashboard'.

Once you add the indicator, on the leftRSI Dashboard will appear.
Displays the RSI indicating oversold/overbought for each time frame,oversold is green、overbought is redand lights up on the board.

Next, the higher timeframes on the board from 30 minutes to 4 hours, enclosed in red boxes,
When all colors align, just enter the trade.
When the colors are aligned across these four timeframes,
there is a high likelihood of a significant rise or fall from here!
there is a high likelihood of a significant rise or fall from here!

The RSI period is 14 by default, but can be changed.
Also, the RSI oversold/overbought levels can be adjusted to your preferred values.
Both can be changed from the red-boxed areas.
In addition, the settings allow fine adjustments such as the colors of oversold/overbought.
Fine-tuning options are available.
Both can be changed from the red-boxed areas.
In addition, the settings allow fine adjustments such as the colors of oversold/overbought.
Fine-tuning options are available.

× ![]()