"Naoto Sakatani's Live Trading" An in-depth analysis of the market from both technical and fundamental perspectives!
From 5:00 PM on Wednesday, May 31, 2017
"Naoto Sakatani's Practical Trade Weekly Market Comment"
will begin on GogojungleTV!
In Naoto Sakatani's publication, "Naoto Sakatani's Practical Trade" (email newsletter),
what kind of daily updates are being delivered?

We will provide you with the latest market analysis!
[The analysis currencies are EUR/USD and USD/JPY]
For Japanese traders, USD/JPY and EUR/USD are the main currencies you trade.
Narrowing the target currencies enables more detailed analysis.
【Analysis method uses Ichimoku Kinko Hyo】
Sakatani uses Ichimoku Cloud in his chart analysis.
For those studying Ichimoku, this is a great opportunity to learn his analytical methods!
If you display Ichimoku on your own chart and check it, your understanding will deepen.
【Deliver four real-time analyses daily and one weekly analysis】
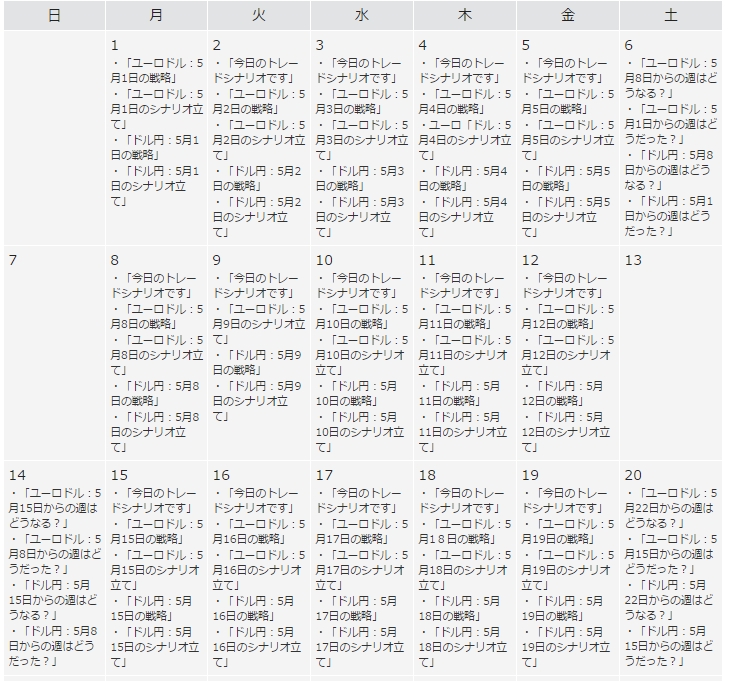
The newsletter can be viewed in its entirety in the "Back Issues" on the fx-on website,
in addition to viewing on mobile, you can take the weekend to review the market analysis in detail.
Now let's briefly introduce the latest contents of each newsletter!
Point: U.S. economic indicators are positive,
so, essentially, U.S. stocks are expected to continue rising,
but,
due to the Russia-gate allegations surrounding President Trump,
and geopolitical risks on the Korean Peninsula,
the dollar's upside is likely to be capped, and we are cautious.
CME currency futures positions: as of May 23
(May 23) (May 16) (May 9)
(May 2) (April 25) (April 18)
Yen ▲51656 ▲60008 ▲36307
▲30483 ▲26869 ▲30463
Euro 64845 37604 22399
▲1653 ▲20895 ▲21649
Pound ▲23867 ▲32995 ▲46798
▲81364 ▲91182 ▲99490
Chicago IMM:
Short-term speculative and investor net positions for the yen
Short positions have slightly decreased.
Chicago VIX Index:
An index indicating the level of fear among investors,
9.81(previous day -0.18)The VIX index has fallen below the 10.0 threshold.
Dollar Index:
An index showing the dollar's moves against major currencies,
97.44(previous day +0.19)The dollar index
This week, even if price action tightens, the middle wave of the range is at a crucial time to determine whether it will break to the upside or downside.
From last week's range, the upside could not hold in the 112s, and the downside sits in the upper 110s within a narrow range—the middle wave of the consolidation.
May 22: 110.92 ~ 111.60
May 23: 110.85 ~ 111.85
May 24: 111.47 ~ 112.12
May 25: 111.48 ~ 111.95
May 26: 110.87 ~ 111.85
Technically, on the daily chart using Ichimoku,
Tenkan-sen is falling to 112.01
Senkou Span 2 is falling to 111.81
Kijun-sen is rising to 111.63
Price line at the close on the 26th: 111.29
Senkou Span 1 is falling to 110.34
Thus the setup is as described.
Technically,
Tenkan-sen > Kijun-sen > Price,
the uptrend that held through the 16th has been broken.
Now the price line is
1) testing upside but blocked by a downward-tilting Tenkan-sen,
2) by the 26th, breaking below the slightly rising Kijun-sen,
3) sitting within the resistance band of the Senkou spans,
4) while the Chikou Span remains above the price line.
With just this information, there is no clear direction.
On a larger scale, looking at the monthly chart,
from the October 2011 low of 75.33 to the June 2015 high of 125.85,
the rise to 125.85 is Wave 1,
then the drop to the June 24, 2016 low of 98.90 is Wave 2,
and now we are in the rising Wave 3 from there.
In this case, upside targets are
NT value = 98.90 + (98.90 - 75.33) = 122.47,
N value = 98.90 + (125.85 - 75.33) = 149.42,
V value = 125.85 + (125.85 - 98.90) = 152.80,
E value = 125.85 + (125.85 - 75.33) = 176.37,
and these are anticipated.
In the medium term (weekly),
from the 98.90 low on June 24 last year to the 118.66 high on December 15 last year is Wave 1,
then the drop to the 108.12 low on April 17 this year is Wave 2,
and now we are in the rising Wave 3.
In this case, upside targets are
NT value = 108.12 + (108.12 - 98.90) = 117.34,
N value = 108.12 + (118.66 - 98.90) = 127.88,
V value = 118.66 + (118.66 - 98.90) = 129.20,
E value = 118.66 + (118.66 - 98.90) = 138.42,
and these are anticipated.
In the near term on a daily chart,
from the April 17 low of 108.12 to the May 10 high of 114.37 is Wave 1,
then the drop to the May 18 low of 110.24 is Wave 2,
and now we are in the rising Wave 3.
Upside targets are
NT value = 110.24 + (110.24 - 108.12) = 112.36,
N value = 110.24 + (114.37 - 108.12) = 116.49,
V value = 114.37 + (114.37 - 110.24) = 118.50,
E value = 114.37 + (114.37 - 108.12) = 120.62,
and these are anticipated.
Upside target is first a breakout above the 115.00–115.50 price range.
Beyond that, the highs to test are the Jan 19 high of 115.60 and the Jan 11 high of 116.87.
An important point is that the current movement centers around 111.50, so
even if pushed down, it does not break at 108,
and a bottoming around 108 is expected to return to 111.50.
The current flow has been progressing as such.
Therefore, the upside target is expected to be 115.
Because 115 = 111.50 + (111.50 - 108).
That is, as long as the central value "111.50" governs,
the price action will continue with the downside corresponding level of 108 translating to the upside target of 115.
The key is whether, after hitting 115, the targets for the third wave can be extended to the N and E values shown above.
One wave momentum indicates
1) Reaching the N value is a minimum condition,
2) Reaching the E value is a sufficient condition.
Downside targets are,
1) From the previous low of 108.12 on Apr 17 to the high of 114.36 on May 10,
the 50% retracement level already reached at 111.24.
Will the central value 111.50 mentioned above function as support?
2) The important point is whether 110.00–112.00 can hold.
If this area is broken below,
3) 101.18 on Nov 9 last year
4) 100.05 on Aug 26 last year.
The expected range is 110.50 to 113.50.
Point: The downside is expected to hold firm.
Reason is the same as last week,
the U.S. is delayed in implementing Trump's policies due to Russia-gate,
and the pace of the Federal Reserve's rate hikes is slowing.
Meanwhile, at the June 2 ECB Council meeting,
forward guidance changes are being anticipated,
talks toward ending monetary easing are expected,
and due to policy divergence between the U.S. and Europe,
the downside is anticipated to be limited.
CME currency futures positions: as of May 23
(May 23) (May 16) (May 9)
(May 2) (April 25) (April 18)
Yen ▲51656 ▲60008 ▲36307
▲30483 ▲26869 ▲30463
Euro 64845 37604 22399
▲1653 ▲20895 ▲21649
Pound ▲23867 ▲32995 ▲46798
▲81364 ▲91182 ▲99490
Chicago IMM:
The euro's net position by short-term speculators/investors has shifted from euro selling to euro buying since 2014,
and has been expanding its long position substantially.
Chicago VIX Index:
An index indicating the level of fear among investors,
9.81(previous day -0.18)
The VIX index has fallen below the 10.0 threshold.
Dollar Index:
An index showing the dollar's moves against major currencies,
97.44(previous day +0.19)
The dollar index continues to stay below 100, trading in the upper 90s.
Last week, after a gap up on Apr 24, the pair is in an ongoing island breakout above.
May 22: 1.1161 ~ 1.1263
May 23: 1.1174 ~ 1.1268
May 24: 1.1167 ~ 1.1220
May 25: 1.1192 ~ 1.1250
May 26: 1.1160 ~ 1.1234
Technically, on the daily Ichimoku chart,
Price line at 1.1173 for the 26th close
Tenkan-sen rising to 1.1121
Kijun-sen rising to 1.0975
Senkou Span 1 at 1.0705 rising slightly
Senkou Span 2 at 1.0700 rising slightly
Technically,
with Tenkan-sen > Kijun-sen > Price,
the price has moved into a buy (Ki) phase since April 24, and since then has continued to rise.
Currently, the following view can be formed.
From the start of the year’s low on Jan 3 at 1.0339,
the rise to the Jan 2? high (Jan 2 or Jan 3) 1.0829 is Wave 1,
the subsequent drop to the Feb 22 low of 1.0493 is Wave 2,
and the rise since then is Wave 3 continuing.
In other words, the Wave 3 has not yet finished from the Jan 3 starting point 1.0339.
Confirmation is seen by breaking above the Mar 27 high of 1.0906.
Here’s the upside targets calculation,
NT value = 1.0493 + (1.0493 - 1.0339) = 1.0647 (reached)
N value = 1.0493 + (1.0829 - 1.0339) = 1.0983 (reached)
V value = 1.0829 + (1.0829 - 1.0493) = 1.1165 (reached)
E value = 1.0829 + (1.0829 - 1.0339) = 1.1319,
and this is anticipated.
The second perspective is
again starting from the Jan 3 low 1.0339 for the base wave
the rise to the Mar 27 high 1.0906 is Wave 1,
the fall to the Apr 10 low 1.0569 is Wave 2,
and the rise from there is Wave 3 continuing.
Thus the Wave 3 from 1.0339 has not finished yet.
Confirmation is seen by breaking above 1.0906.
Now, the upside targets are
NT value = 1.0569 + (1.0569 - 1.0339) = 1.0799 (reached)
N value = 1.0569 + (1.0906 - 1.0339) = 1.1136 (reached)
V value = 1.0906 + (1.0906 - 1.0569) = 1.1243 (reached)
E value = 1.0906 + (1.0906 - 1.0339) = 1.1473,
and this is anticipated.
The third perspective is
again starting from the Jan 3 low 1.0339 for the base wave
the rise's first wave has not finished yet
and thus
1) the current year’s high 1.1268 on May 23,
2) the E value 1.1319 from the first case above,
3) the E value 1.1473 from the second case above,
The expected range is 1.0900 to 1.1300.
Today: May 31, 2017
Currency pair: USD/JPY
Posting level: 110.86
We continue to look for buying opportunities, but
on the 29th, on the daily Ichimoku chart,
the Tenkan-sen crossed below the rising Kijun-sen
and that relationship remains,
the bearish era continues.
The previous low of May 18 at 110.24
the key 110.00
the lower bound of the Senkou Span 109.93.
If this breaks lower,
there is a possibility to drop to the Apr 17 low of 108.13
as well.
However, even then,
breaking below 108.13 or 108.00 is not expected to cause a market bottom break
As long as the levels below do not break 110.24, 110.00, 109.93,
there is a potential for another upside recovery.
To confirm an upside move,
it is necessary to break above the previous high of May 24, 112.12.
With this amount of information, the monthly fee is 5,000 yen.