

【Copy & Paste OK】A method to fetch US stock price data with Python and compare returns
・I want to quickly compare the stock prices of the tickers I’m interested in
・I want to analyze financial data with Python
・I want to know the long-term trends of the individual stocks I purchased
I’ll write articles for people like this.
What we will create this time
is a Python code that compares, with graphs, how much price movement there was for multiple specified U.S. individual stocks over a period specified by the user
.
In short, it’s a program that visualizes the desired stock price data trends.
Whether you’re making automated trading bots or conducting some technical analysis, you need stock price data to begin with.
For Python beginners, it’s a useful program to get started with.
For example, you might think, “I want to compare GAFAM stock price movements from January 1, 2020 to October 12, 2020.”
If you run this program in that case, it will generate an image like this.
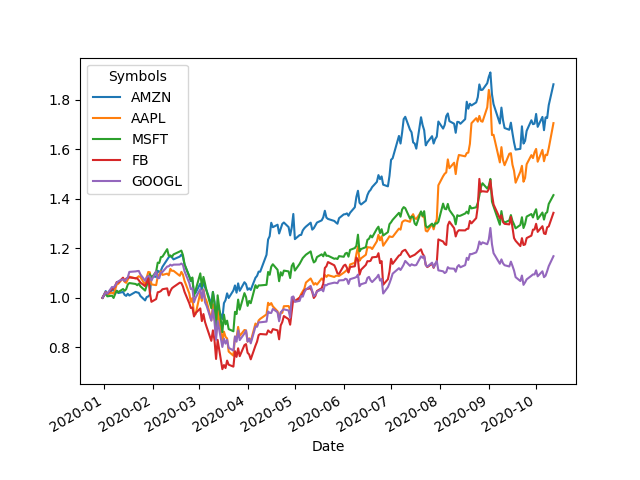
Among GAFAM, Amazon clearly showed the largest stock price growth during this period.
The code to generate this is below.
import pandas_datareader.data as web
import datetime as datetime
import matplotlib.pyplot as plt
import pandas as pd
# Specify the data period and tickers (symbols)
start=datetime.datetime(2020,1,1)
end =datetime.datetime(2020,10,12)
print("Starting data retrieval. Default source is Yahoo Finance")
print("Data period: "+str(start)+" ----> "+str(end))
all_data = web.DataReader(tickers,
'yahoo',
start=start,
end=end)
print("Data retrieval complete")
print("Summarizing results")
# This time we’ll store only the adjusted close values in df
df = all_data["Adj Close"]
# Calculate returns
df=df/df.iloc[0]
# Add a date column
df["Date"] = all_data.index
print(df.dtypes)
df.set_index(["Date"],inplace=True)
# Sort by the biggest returns in descending order of the last date
df=df.sort_values(df.index[-1],axis=1,ascending=False)
# Plot
pd.set_option("display.max_rows",None)
df.plot()
# Save image
plt.savefig("result.png")
# Save numeric data
df.to_csv("result.csv")
print("Done.")
print("Wrote each ticker's price movement graph to result.png and numerical data to result.csv")
Specify the period you want to investigate with start and end at the top and enter the tickers you’re interested in with tickers.
You should be able to run it just by changing these two things.
(Copy and paste and modify to play around, it may deepen your understanding of pandas)
Note
1. If you see an error like ModuleNotFoundError, install the module via pip as needed.
2. If you see AttributeError: 'numpy.datetime64' object has no attribute 'toordinal',
3. In the future, if Yahoo Finance changes its terms, this code may stop working properly.
UsuallyStock Investing Blog andnote publish investment-related articles.
If you like, please take a look (^^)b
