

A high risk-reward ratio of 1.7268 achieves a smooth upward profit-and-loss curve in the ultra-long term Precious
When interviewing people who are skilled at EA trading, in the short term wins and losses intermingle and the profit-and-loss curve is jagged, but when viewed over the long term or ultra-long term, the EA that draws a smoothly rising profit-and-loss curve is often heard as ideal.
Set one position on GBP/JPY with a 71-pips stop loss.
Identify the trend on the long-term chart and enter at a pullback timing considered valid.
Stop loss is a fixed value, take profit uses a trailing-stop method; a swing-trade typePrecious is also an EA that is no exception to that.
I would like to review the 17-year backtest of TDS.
Note: Although the unit is dollars, the backtest data are based on Japanese yen by OANDA Japan, so the unit is in Japanese yen.
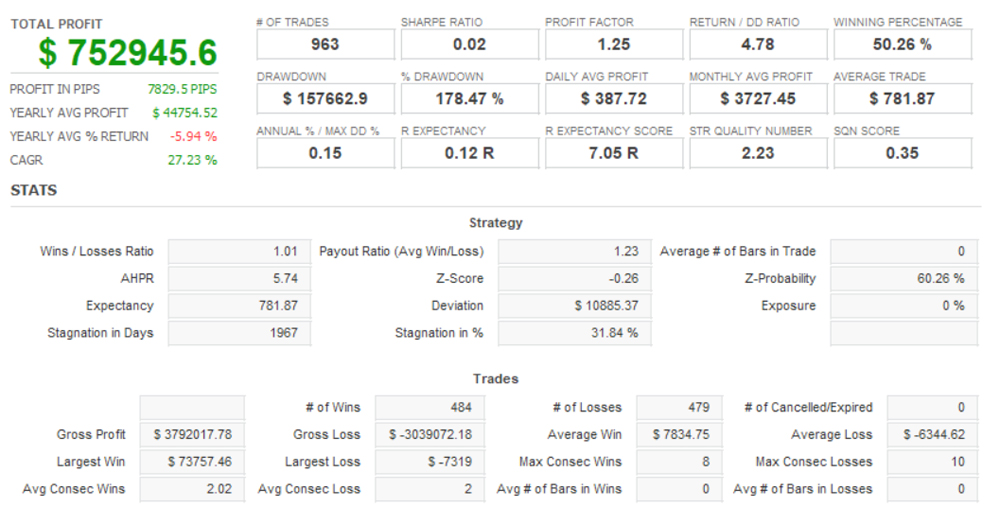
Annual average profit: ¥44,754
Win rate:50.26%
Annual average number of trades: 56
Average profit per trade: ¥7,834
Average loss per trade: ▲¥6,344
Risk-reward ratio: 1.2348
Maximum drawdown: ¥172,292 (15.85%)
Risk-return ratio: 4.37
It stands at 4.37.
The risk-reward ratio remains clearly positive, and with a win rate above 50%, it shows an excellent logic for a swing-trade type that steadily increases profits.
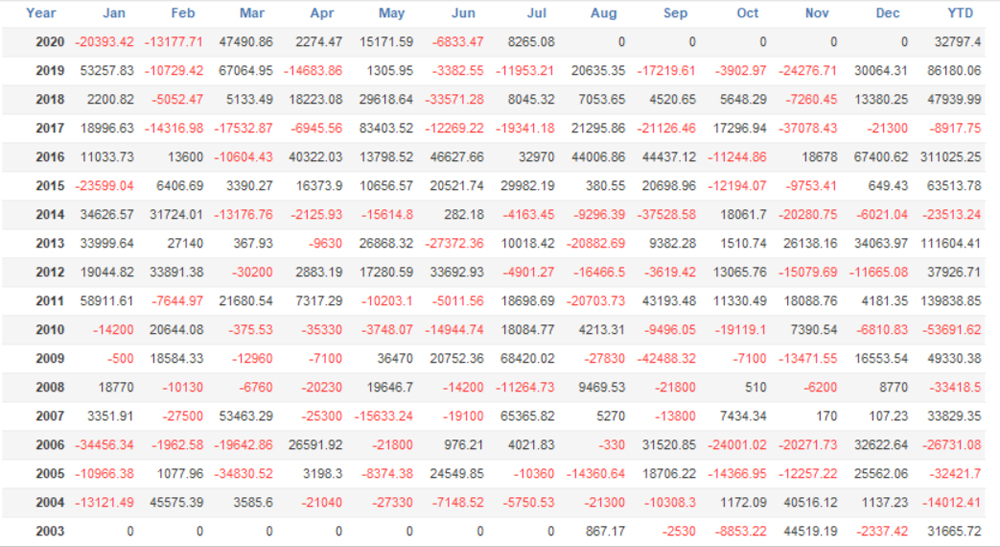
In terms of annual overall performance since 2010, since 2010, except for 2010, 2014, and 2017, it has been profitable.
Not only the backtest results, but also on GogoJungle's forward test that began in early March 2019, profits have been accumulating on an upward trajectory.
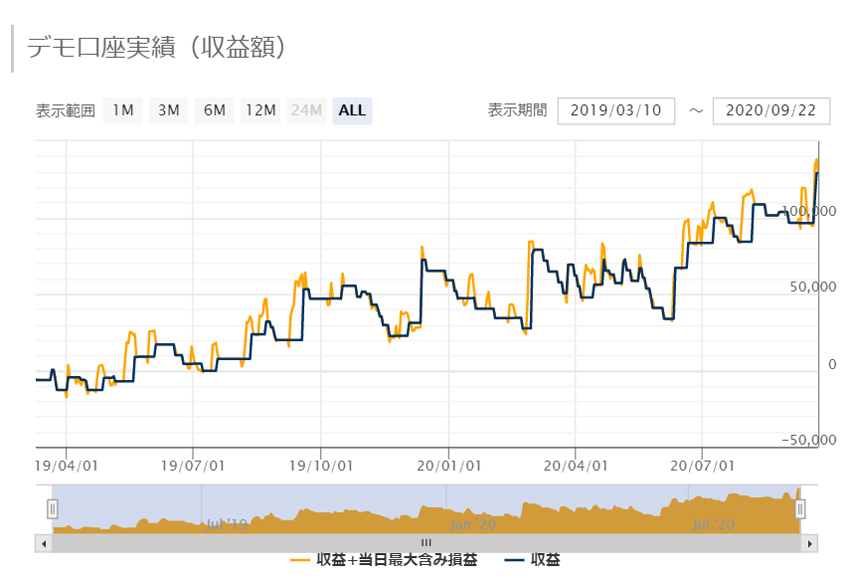
Profit: ¥128,950
Win rate:45.74%
Annual average number of trades: 56
Average profit: ¥9,796
Average loss: ▲¥5,673
Risk-reward ratio: 1.7268
Maximum drawdown: ¥48,362 (21.85%)
Risk-return ratio: 4.37
Compared with the backtest, the considerably higher risk-reward ratio covers the somewhat lower win rate.
As mentioned at the outset, when viewed on the long-term or ultra-long-term, it draws a smoothly rising P/L curve; for a swing-type, a high risk-reward ratio is realized.
Written by Hayakawa


