
Unique Clothing EA Verification

Backtest Verification
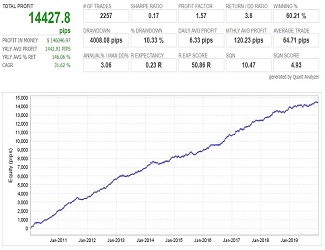
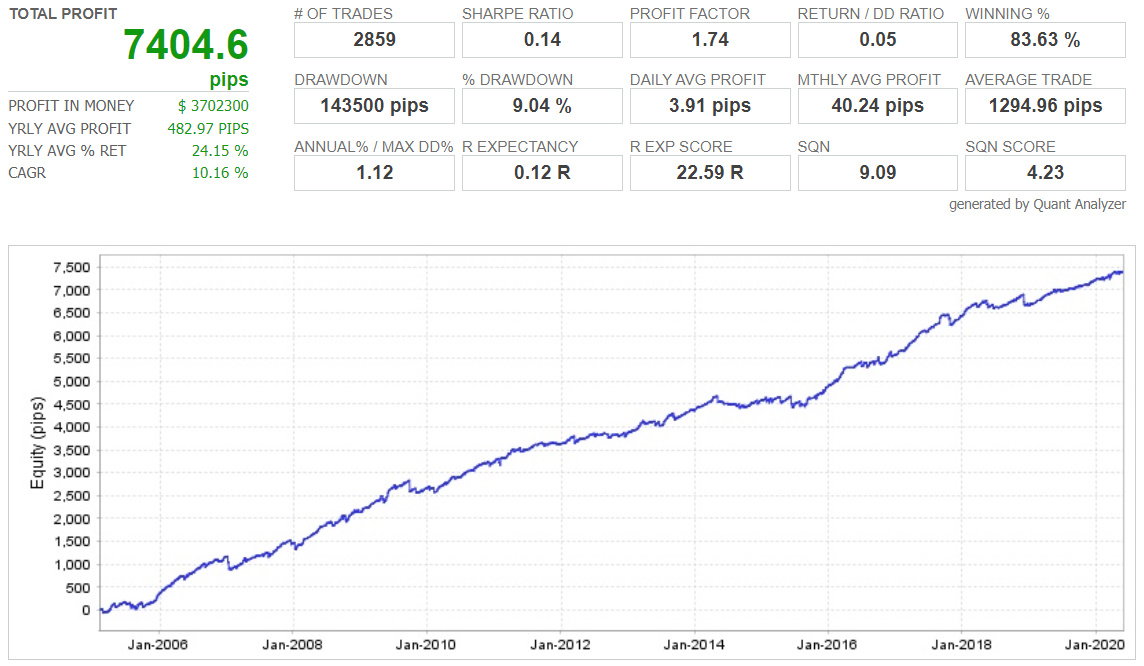
Test Period: 2005.02.01 – 2020.06.01
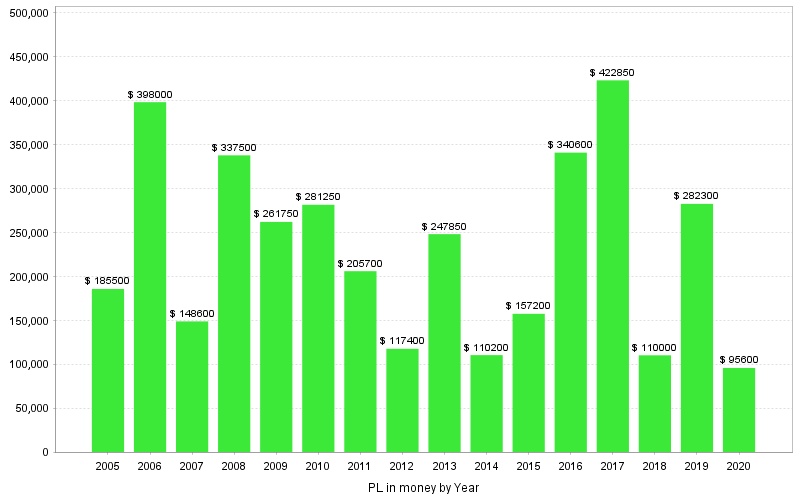
Breakdown of Profit and Loss
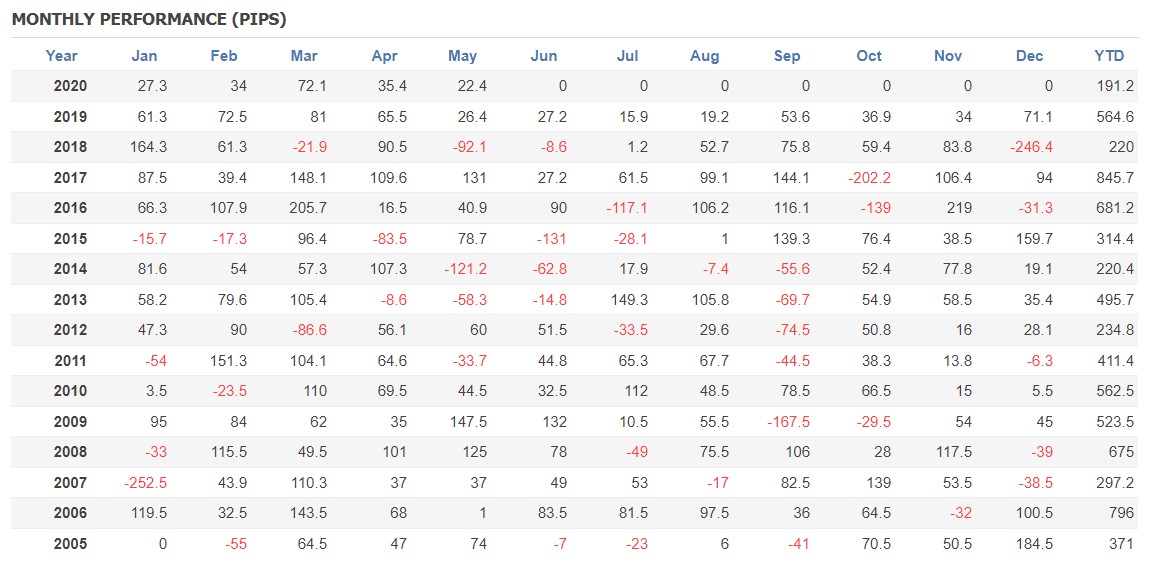
Annual Profit and Loss Chart
Win Rate
Number of Trades
The number of trades in one year is approximately184 trades.
The forex market is open about 260 days per year,
so, calculated from that,
the number of trades per day is
approximately0.7 trades
per day.
Profit Factor (Risk-Reward Ratio)
Average Profit: +7.28 Pips
Average Loss: -21.38 Pips

Maximum Profit: +45 Pips
Maximum Loss: -90 Pips
What is the Risk-Reward Ratio
The risk-reward ratio is the ratio of average profit to average loss.
Example
If average profit is 10 Pips and average loss is 10 Pips, the ratio is 1
If average profit is 20 Pips and average loss is 10 Pips, then 2
If average profit is 10 Pips and average loss is 20 Pips, then 0.5
If the value is greater than 1, it indicates small losses with large gains;
if less than 1, it indicates large losses with small gains in the EA.
PF (Profit Factor)
What is PF (Profit Factor)
Profit Factor (PF) is a measure of how many times the total profit exceeds the total loss.
It is also called the expected value.
The PF calculation is
Total Profit ÷ Total Loss.
By looking at PF, you can see how many times more profit than loss is generated.
For example, a PF of 2.0 means profit is twice the loss.
Entry Time and Time-Based Profit/Loss Winter GMT+2, Summer GMT+3
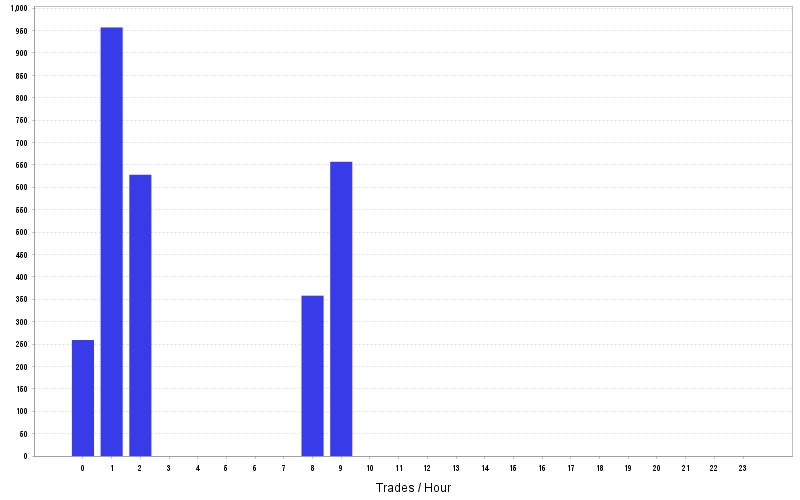
Number of Entries
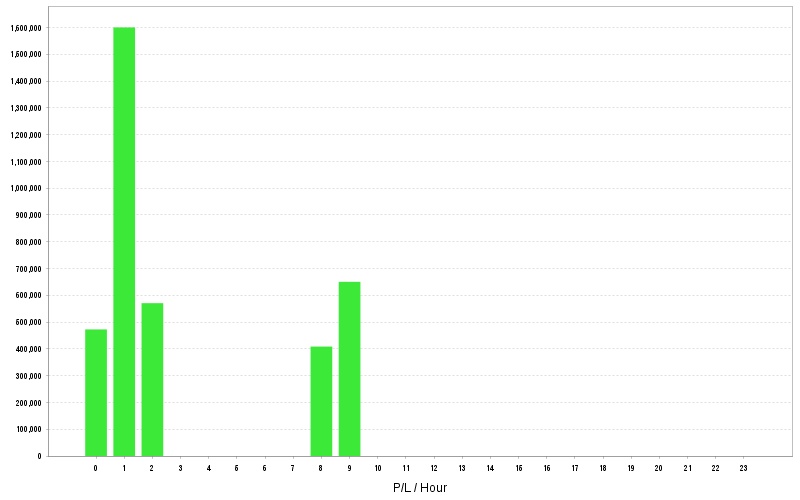
Time-Based Profit/Loss (Total)
Time-Based Profit/Loss (Individual)

Entry times are 0–2 and 8–9 o'clock.
About GMT
The MT4 timezone uses standard winter time GMT+2 and summer time GMT+3.
During winter time (November–March), it is GMT+2, and the time difference with Japan is -7 hours.
During summer time (March–November), it is GMT+3, and the time difference with Japan is -6 hours.
How to convert to Japan Time
To convert this GMT to Japan time,
add 7 hours in winter time,
add 6 hours in summer time.
Winter time: MT4 8:00 = +7 hours → Japan time 15:00
Summer time: MT4 13:00 = +6 hours → Japan time 19:00
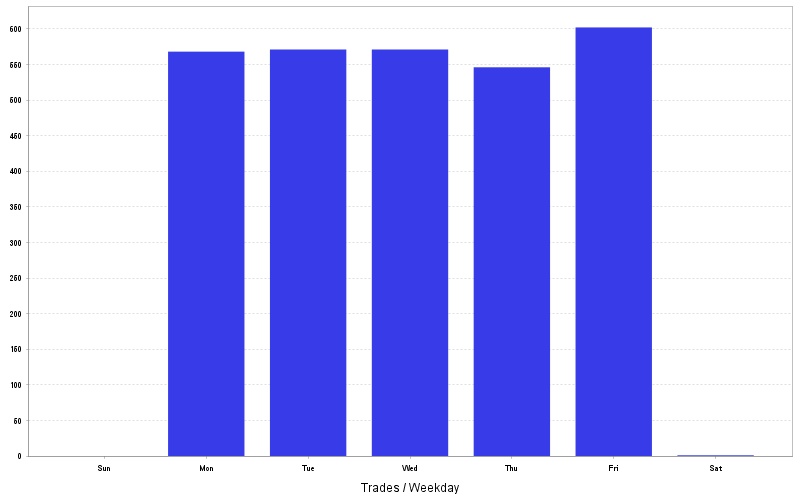
Entry Day of Week and Profit/Loss by Day
Number of Entries
Profit/Loss by Day (Total)
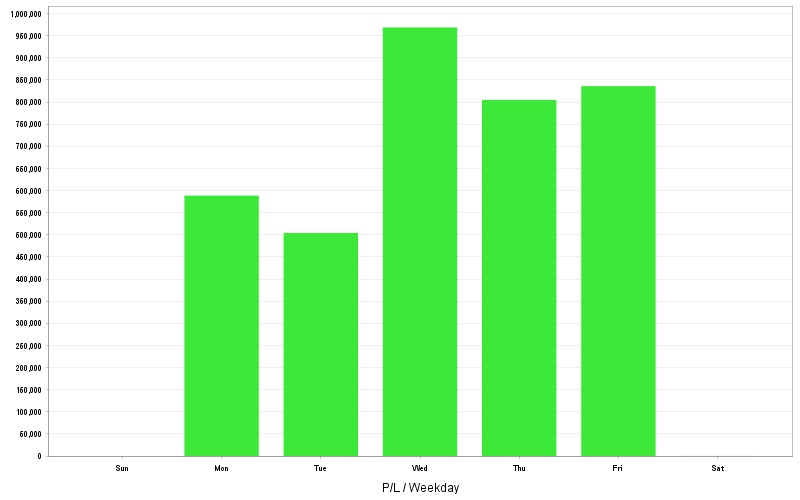
Entry days are Monday through Friday.
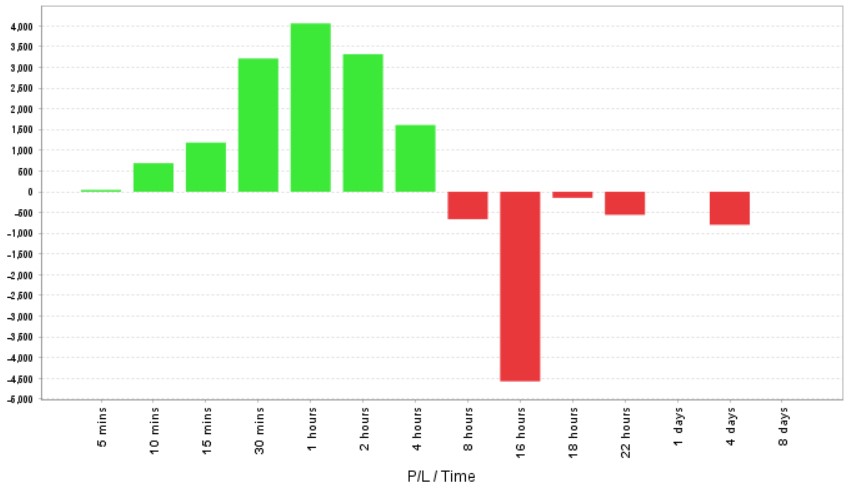
Position Holding Time and Profit/Loss
Characteristics of Winning and Losing Trades
A negative Z-Score indicates a higher likelihood of consecutive wins or losses.
What is Z-Score
Z-Score represents the serial dependence of trades.
A positive Z-Score suggests a higher likelihood that wins and losses alternate.
A negative Z-Score suggests a higher likelihood that wins or losses occur in sequence.
Asset Curve Stagnation Period: Stagnation in Days
The longest period before updating profits over the 16-year span was 540 days.
What is Stagnation in Days
Stagnation in Days refers to the time taken for the asset curve to reach a new profit high.
When drawdowns or sideways performance occur, this period can lengthen.
Stagnation in Days evaluation criteria
0–150 days: short
151–300 days: somewhat short
301–450 days: normal
451–600 days: somewhat long
601 days and above: quite long
EA Evaluation: SQN SCORE
What is SQN SCORE
SQN SCORE is the evaluation value of an EA calculated as "Expectancy / Standard Deviation × √100".
SQN SCORE evaluation scale
1.6 and below: average or worse
2.0: average
2.5: good
3.0: excellent
5.1: best
7.0: masterpiece