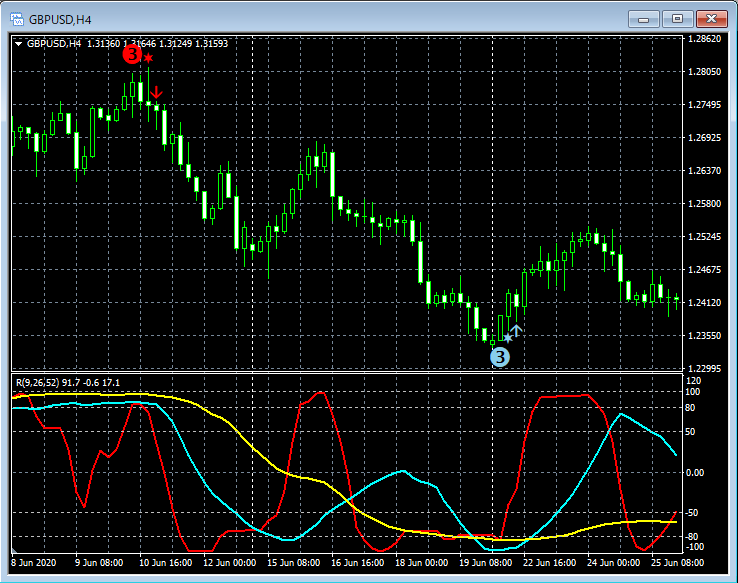
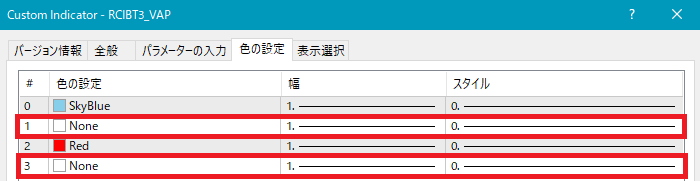
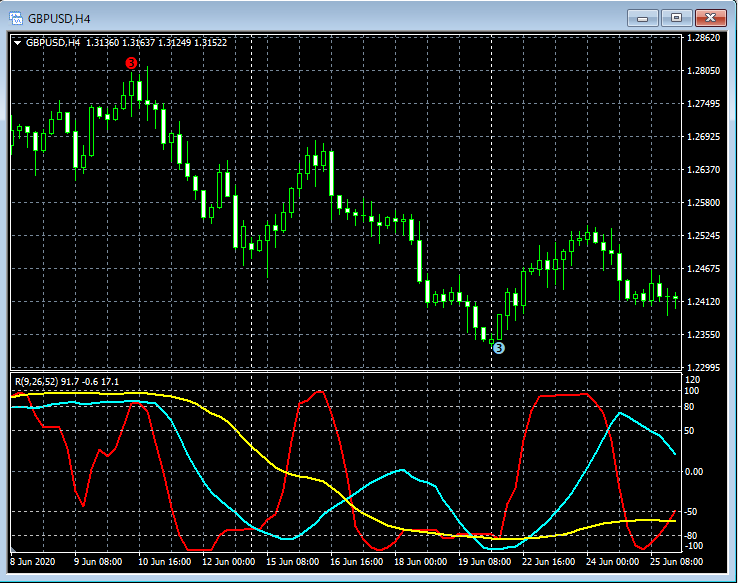
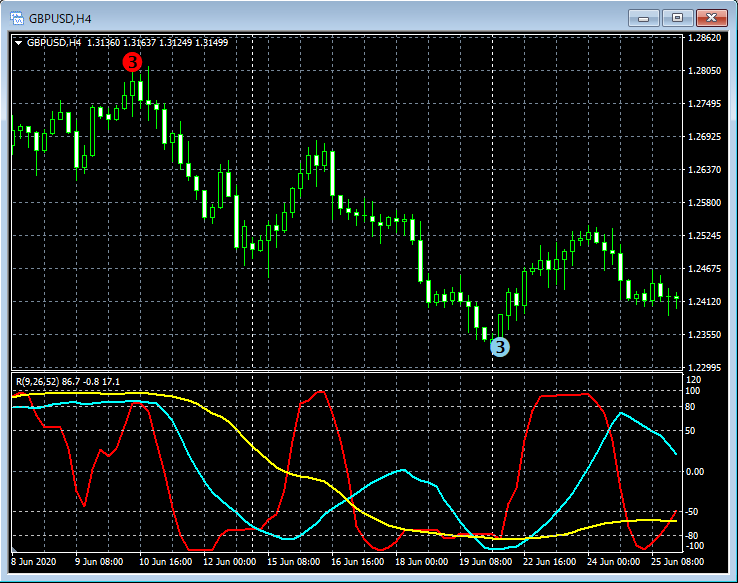
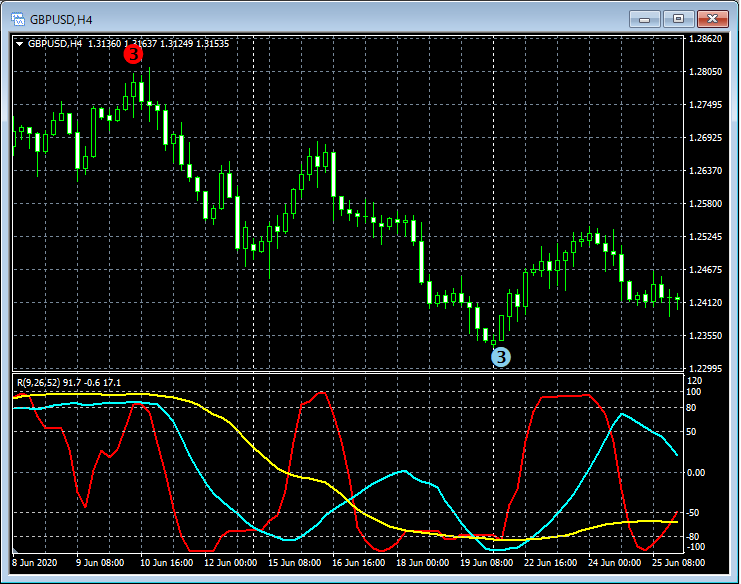
Chart settings focusing on the RCI3 double-top and RCI3 double-bottom
RCIis an indicator that ranges between -100 and +100. When it reaches the overbought territory (for example +80 or higher) it may be interpreted as overbought, and when it reaches the oversold territory (for example -80 or lower) it may be interpreted as oversold.
On the other hand, RCI can cling to the overbought or oversold zone, and in that case it may be interpreted as a continuing strong uptrend (downtrend).
Additionally, it is common to combine three RCIs, using RCI9 for short-term, RCI26 for mid-term, and RCI52 for long-term. This trio is often referred to as the“Three-Line RCI”组合.
When the Three-Line RCI reaches the overbought zone simultaneously (for example +80 or higher) it may be called“Threefold RCI Top, and when it reaches the oversold zone simultaneously (for example -80 or lower) it may be called“Threefold RCI Bottom.
Because all three RCIs are aligned in the overbought (or oversold) zone, Threefold Top (Threefold Bottom) may be judged as being in an even more overbought (oversold) condition than when one or two RCIs are in the overbought (oversold) zone.
Conversely, in a Threefold Top (Threefold Bottom) the three RCIs may stick together in the overbought (oversold) zone, in which case a very strong uptrend (downtrend) may be continuing.
From the above, the Threefold Top (Threefold Bottom) RCI may be considered one of the important chart points.
Here, I would like to introduce one chart setting that might help in dealing with the Threefold Top (Threefold Bottom) RCI.
In the charts featured in this article, in addition to the indicator that displays the three-line RCI, two other indicators are used below.
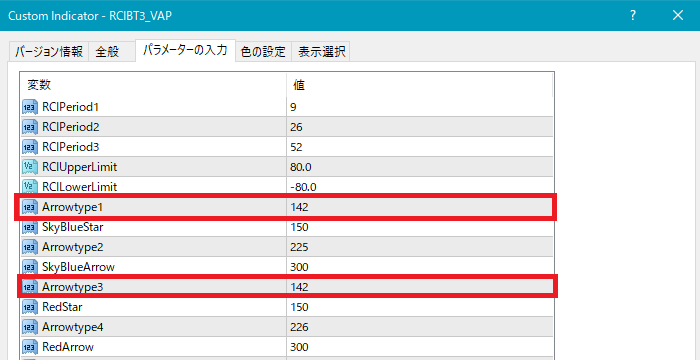
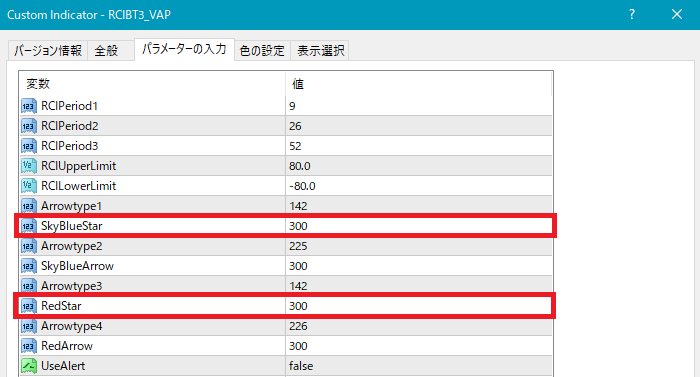
(1)【RCIBT3】
MT4 indicator that notifies you when the three RCIs reach the top (or bottom)
(i.e. it notifies when the Threefold Top (Top and Bottom) is reached)
This indicator is
“RCI Threefold Top (Bottom), Twofold Top (Bottom), Top (Bottom) Alert MT4 Indicator【RCIBT】”
https://www.gogojungle.co.jp/tools/indicators/22204
included.
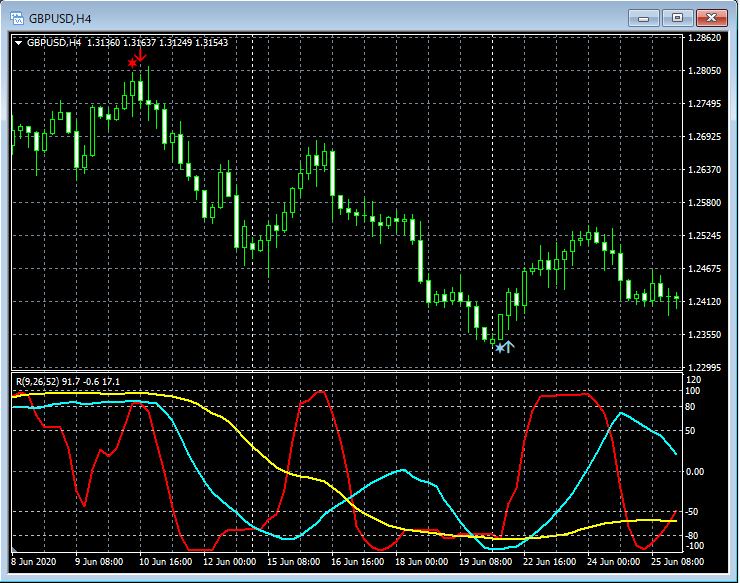
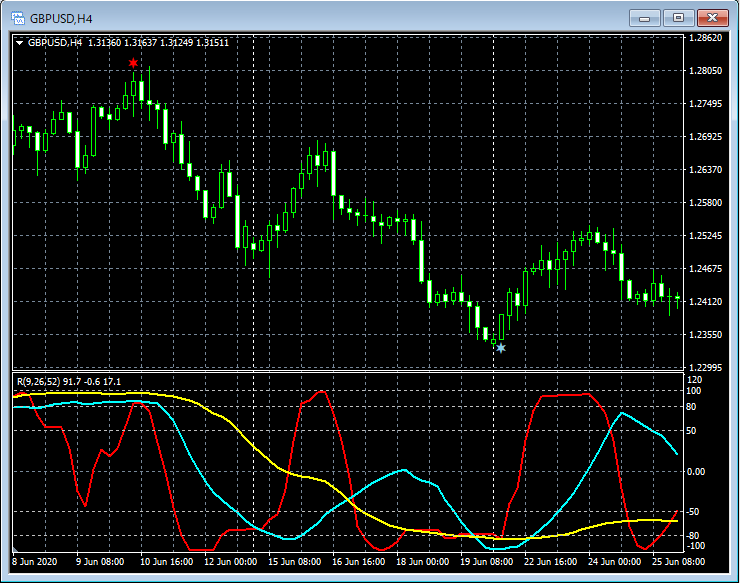
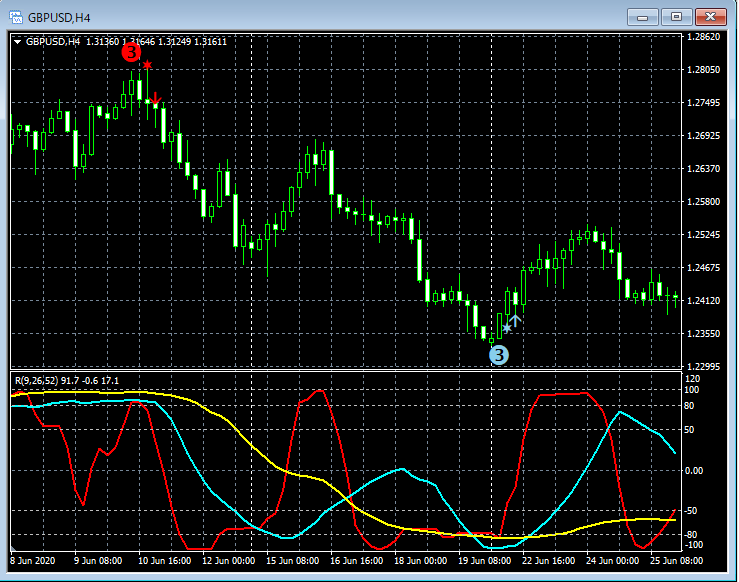
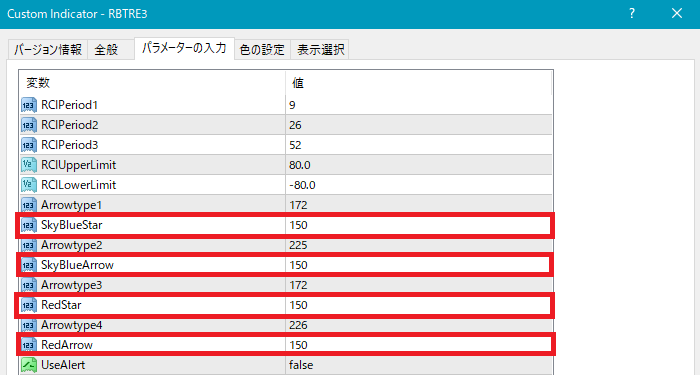
(2)【RBTRE3】
Arrow indicator that displays when the short-, mid-, and long-term RCIs reach the overbought (oversold) line and the short-term RCI reverses from outside to inside the overbought/oversold line
This indicator is
“Arrow Indicator for Reversal from RCI Trough/Peak【RCIRE・RBTRE】”
https://www.gogojungle.co.jp/tools/indicators/23237
included.
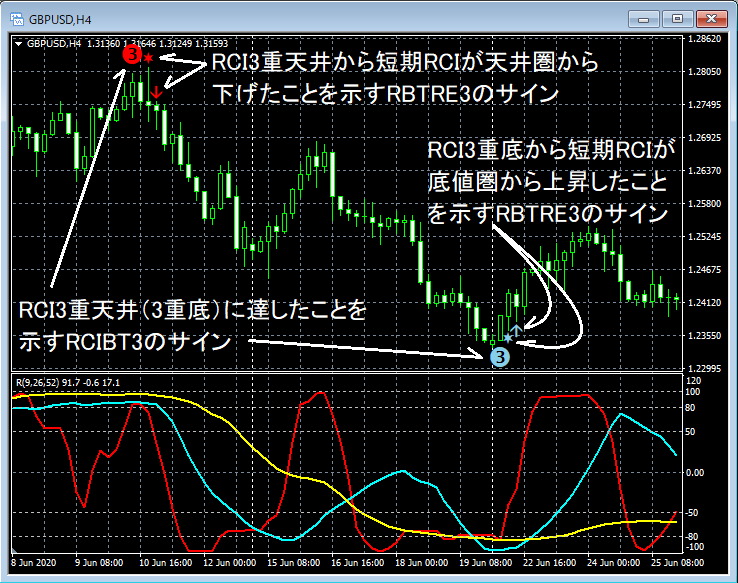
Chart Example-2
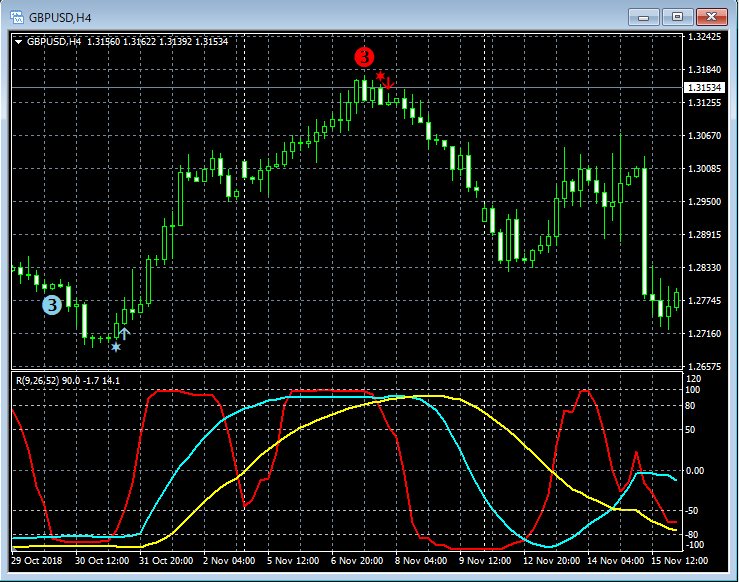
Chart Example-3
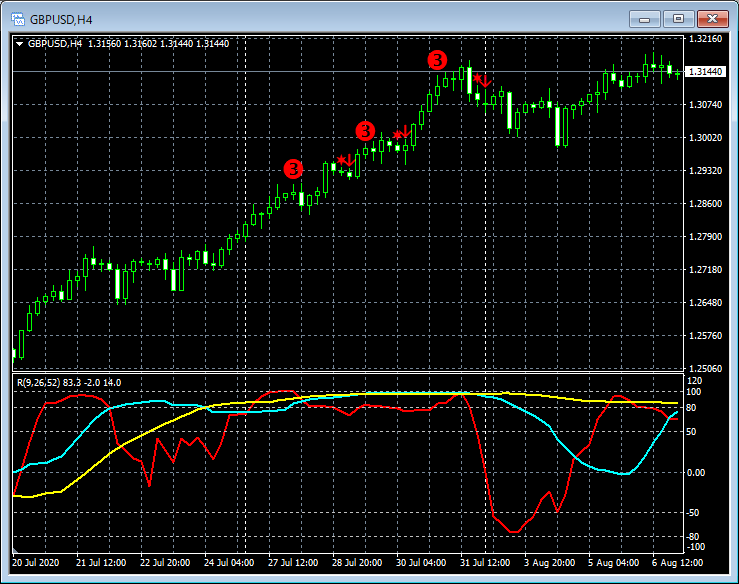
Chart Example-4

RCI Threefold Top (Bottom), Twofold Top (Bottom), Top (Bottom) Alert MT4 Indicator【RCIBT】
https://www.gogojungle.co.jp/tools/indicators/22204
The above product includes indicators that notify not only RCIBT3 but also twofold Top (Bottom) and Top (Bottom).
Arrow Indicator for Reversal from RCI Trough/Peak【RCIRE・RBTRE】
https://www.gogojungle.co.jp/tools/indicators/23237
The above product includes three indicators in addition to the RBTRE3 introduced in this article.