

AUDJPY scalping with profitability above PF2, "Exotic Apollo Boost"
Exotic Apollo Boost Overview
This is a five-position scalping for AUDJPY.
TP 100, SL 190 pips
Entries are made using a trend-following logic.
The forward period is still short, but it has gained +50 pips in one month.
What kind of trades does it make?
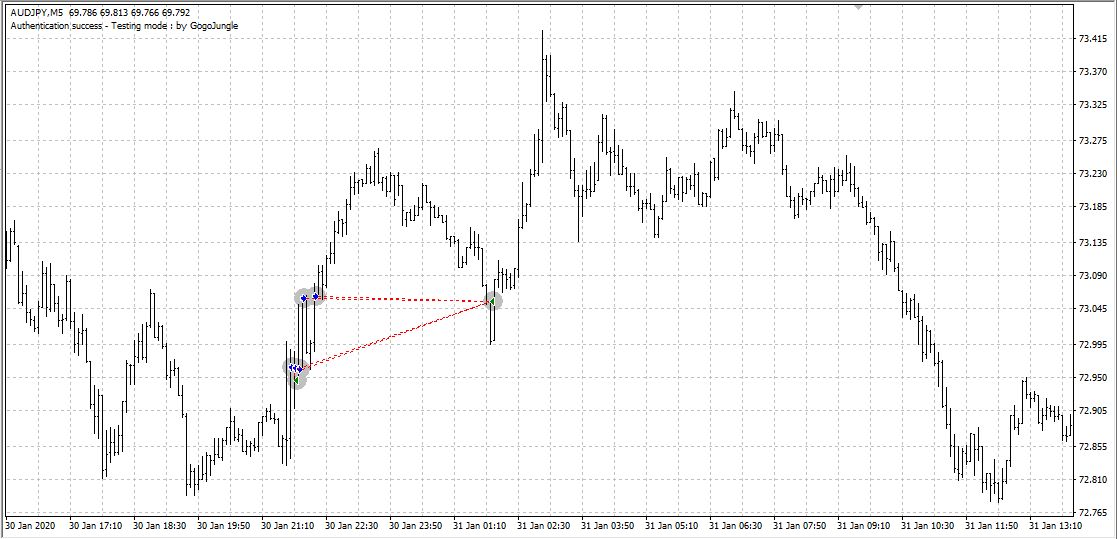
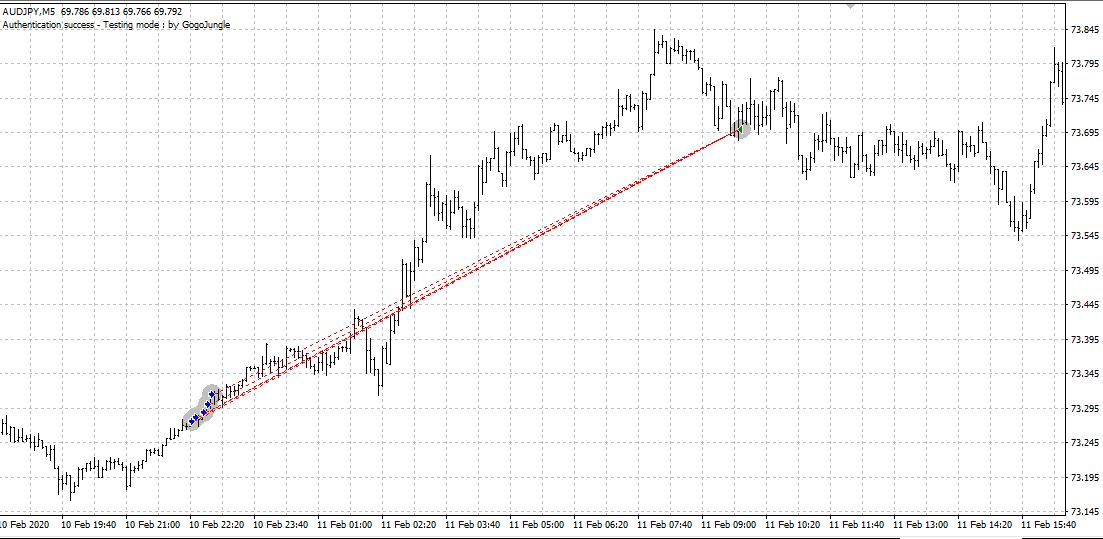
▲ Blue: SELL — Up to 5 positions on one side, following the latest trend to sell on pullbacks and buy on dips; a trend-following type.
Entries are made with multiple positions, and when profits are available, all are closed at once.
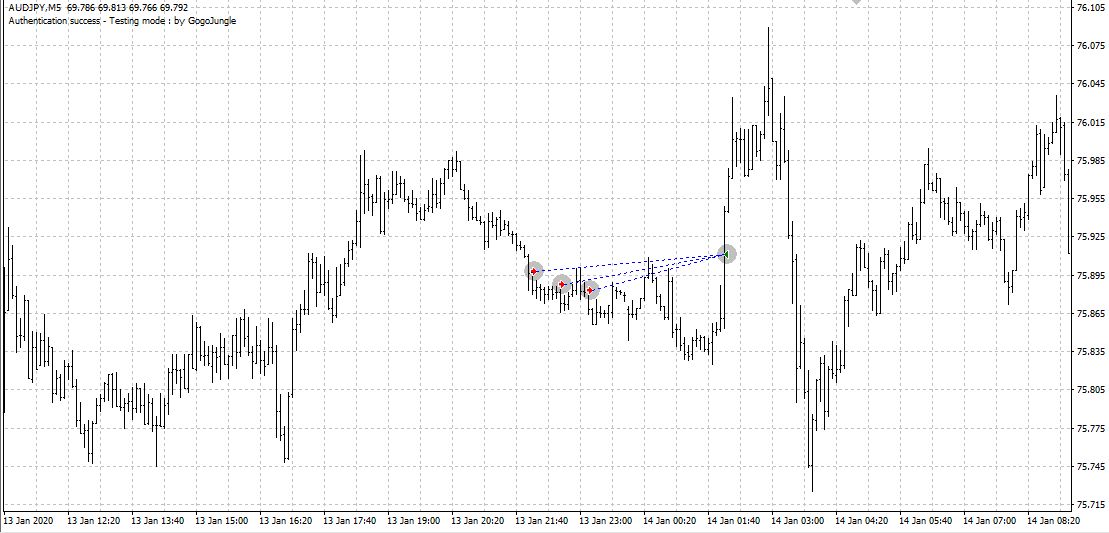
▲ Red: BUY
▲ Note: In stop-out cases, up to 5 positions × 190 pips can be wiped out, so keep that in mind.
Backtest Highlights
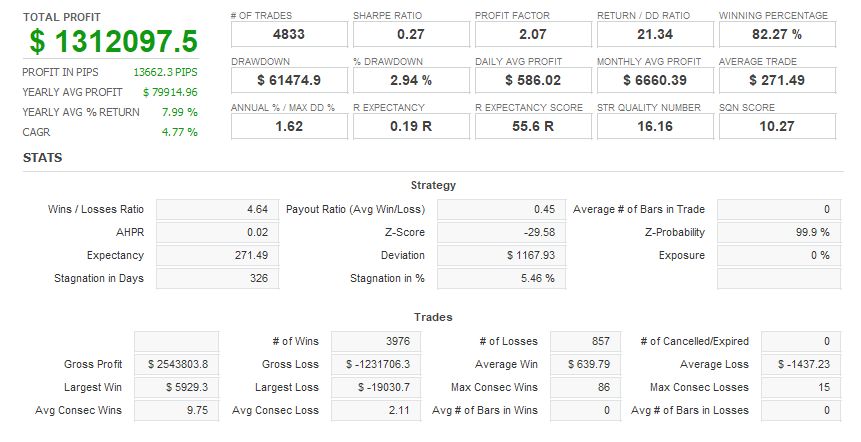
Official backtest (2003–2020) data shows the mean gain to mean loss as 639:-1437, yielding a payout ratio (also called risk-reward ratio) of 0.45; with this balance, a win rate of over 80% would allow fairly stable operation.
Also, the PF is 2, meaning total profit is twice total losses.
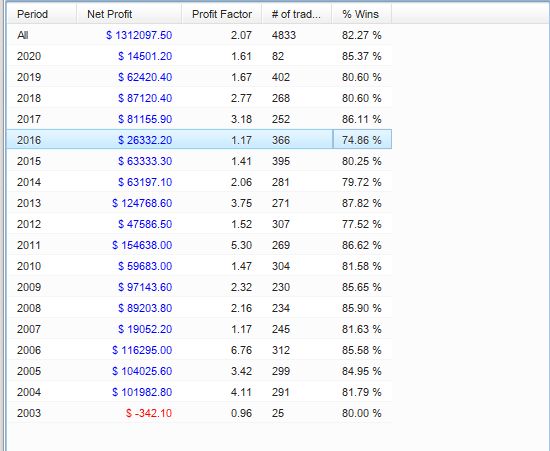
▲ PF and win rate, profits by year
If you exclude 2003 (only December), PF varies quite a bit. It ranges from as low as 1.17 in 2016 to as high as 6.76 in 2006!
On average across 17 years, PF is 2, but it's quite rare to see PF 2 in an EA.
If PF falls below 1, total profit becomes negative, so caution if win rate falls below 70%.
Recommended Margin and Expected Annual Return?
The figures quoted from backtest data are as follows.
Backtest years: 17.4
Annual average profit: ¥75,000
Annual average number of trades: 278
Maximum DD: ¥94,000
Maximum open positions: 5
Required margin per 0.1 lot: ¥30,000
((3*5) + (9.4*2)) = 33.8 (万円)
Because the required margin for AUDJPY is only 30,000 yen per 0.1 lot, the required margin turned out to be lower than expected.
Since the annual average profit is 75,000 yen,the expected annual return is 22%.
What is the realistic growth rate with compounding?
As stated on the official page, there is a claim that 100,000 yen could grow to 2 billion with compounding.
Compound interest increases capital faster the more trades you execute and the higher the PF. Also, the longer the operating years, the more exponentially the profit-and-loss curve rises.
Exotic Apollo Boost has an average of 278 trades per year, and considering you may hold 5 positions per trade, it's about 50 trades per year, so it's not that frequent; however, with a win rate above 80% and a high PF, you can quickly increase the number of lots held.
Realistically, it's unlikely to run compounding for more than 10 years, so let's look at 2 years and 4 years.
As for parameters, with the default MM risk of 2%, you use 2% of the account to hold lots. That means with 1,000,000 yen you only use 20,000 yen, so the risk is low but a bit wasteful, though.
With an account balance of 380,000 yen, using 0.5 lot (0.1×5) worth 150,000 yen would keep the maximum DD at 50%, so it's okay to use 39% of the account funds... but
This calculation uses 25x leverage; if leverage differs, compute the risk percentage by deriving from the allowable maximum DD.
With 25x leverage and a setting where maximum DD is 50% of the account, I backtested with MM risk at 39%.
Last 2 years (2018–2019)
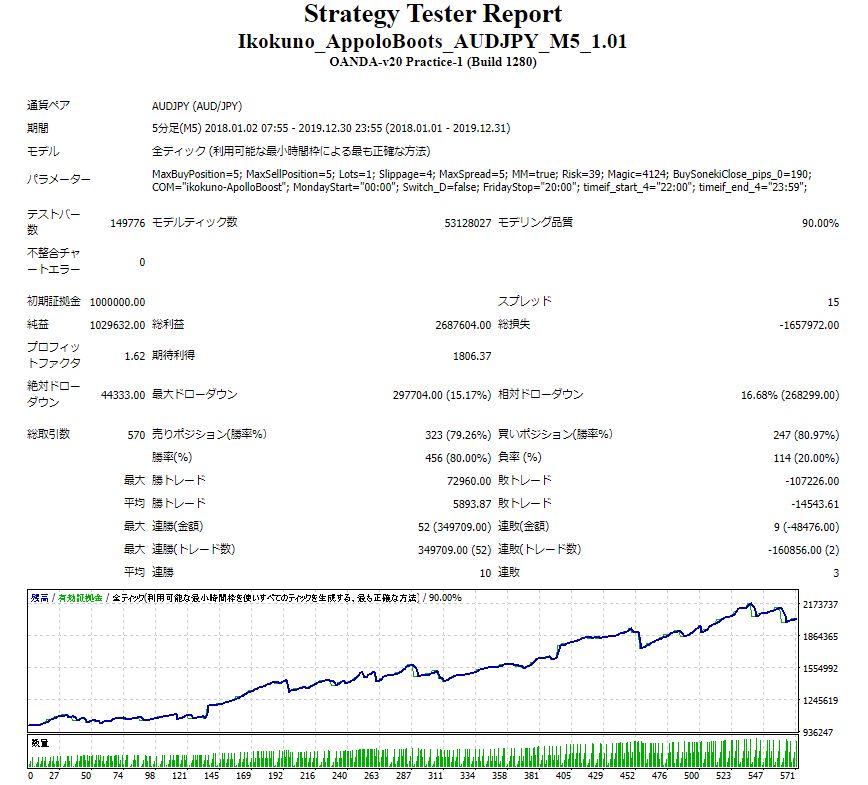
▲ Relative DD 16%, net profit +100% increase
Last 4 years (2016-2019)
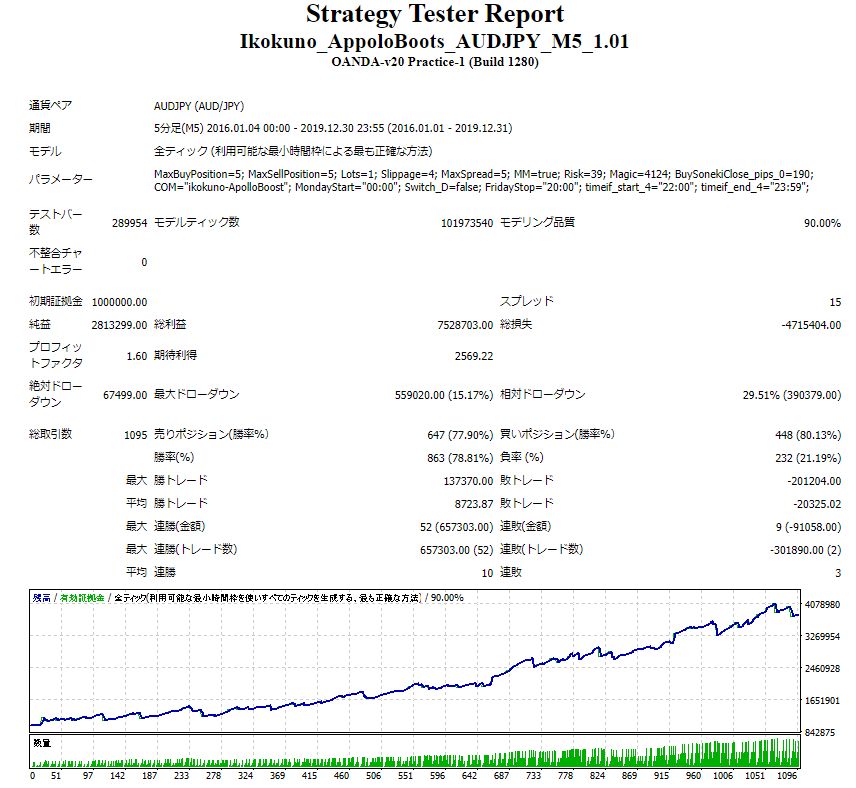
▲ Maximum DD 29%, net profit +280% increase
This is the result. The compound risk percentage should be determined based on how much maximum DD you want to keep.
PF-friendly EA is usually a non-stop-loss grid-type with poor trading frequency; but
This is an exceptionally stable EA with PF2 or higher at the entry logic and a decent number of trades.

Written By Tera GogoJungle Marketing.


