"Star Harmonic" that selects and displays patterns with a high reversal success rate
Harmonic pattern trading is a relatively new chart analysis technique that originated in the West.
In terms of its use, since patterns are likely to reverse when completed, it is used for counter-trend trading.
It looks visually appealing, so many people may be interested, but in practice applying it to trading is quite challenging.
Because,
・If harmonic patterns overlap, which one should be given priority?
・If the pattern completes but the reversal does not occur and the trend continues, where should you place the stop loss?
・After pattern completion, where should you place the take-profit target for the reversal?
Since these decisions must be made by personal discretion, there are quite a few cases where beginners who enter with "Pattern complete! Counter-trend entry!" end up being wiped out.
This time we introduce an indicator called "Star Harmonic" that can be recommended even to those who have previously struggled with harmonic pattern trading.

How do you determine the entry zone, stop loss, and take-profit targets in harmonic patterns?
The most difficult part of harmonic pattern trading is probably the stop loss and take-profit targets.
In that regard as well, Star_Harmonic expresses them in an easy-to-understand way.
The following is a quote from the seller Peaky FX's blog
Entry

When the harmonic pattern conditions are met, the chart will display the pattern figure, and in the space on the right, Fibonacci retracement and the PRZ are displayed.
PRZ stands for Potential Reversal Zone, and is composed of levels from multiple Fibonacci extensions/expansions. In simple terms, it indicates that once the pattern is valid, reversals are more likely within this zone.
In other words, the reversal signals indicated by each pattern are not pinpoint levels — they are price levels represented as a zone.
Among the levels contained in the PRZ, if multiple levels overlap/are close or intersect with a trendline, the probability of reversal is higher there. When deciding entry points, take these PRZ characteristics into account and enter at as close to the pullback position as possible.
In the above figure, entering at the point where the sign appeared isn't bad, but it would be better to enter by pulling back to the first line inside the PRZ (107.35).
Exit (Take Profit)
The reversals captured by harmonic patterns vary from large to small. For take-profit targets, set the initial target at the 38.2–61.8% level, and once reached, use a trailing stop to extend profits.
Specifically, for larger patterns with bigger price moves, you should adjust to 38.2%; for smaller patterns, 61.8%.
The trailing stop method described is to set a 38.2% retracement from the highest/lowest reached after the reversal. Since this is difficult without special tools, in practice you would substitute with a normal fixed-width trailing stop.
Exit (Stop Loss)
The stop-loss is also guided by PRZ. PRZ is a resistance line where reversals tend to occur, so placing a stop at that level is reasonable.
It is okay to mechanically place the stop at the innermost level within the PRZ, but it is recommended to place a tight stop at levels where reversals are likely using the aforementioned characteristics. Harmonic patterns are clear: when they work, they work; when they miss, they miss cleanly, making it easy to implement trades with small losses and large profits.
In the above figure, there are only two lines in the PRZ, with no overlaps or proximities, so you would place the stop at the second line.
Quotation:Trade methods using harmonic patterns
That concludes how to trade using Star Harmonic; here are some points I found convenient.
Arrow sign display makes entry timing easy to verify
In historical chart shapes, there are cases where pattern recognition can take multiple forms.
In that case, when multiple patterns are drawn they overlap and become hard to recognize.
Star_Harmonic keeps all patterns except the latest as text and arrow signs, making it easier to confirm later whether that pattern was valid.
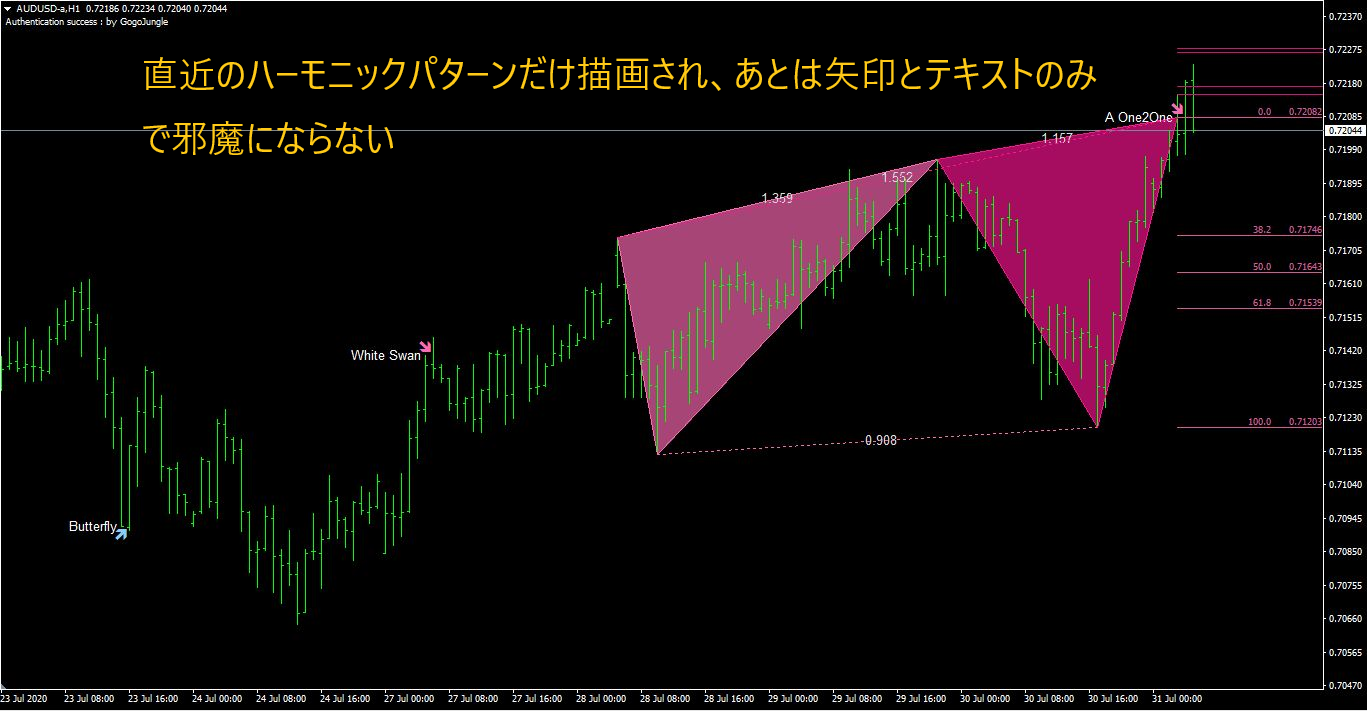
▲ Only the most recent harmonic pattern is drawn. If it is filled in red, the counter-trend reversal is clearly “sell”.
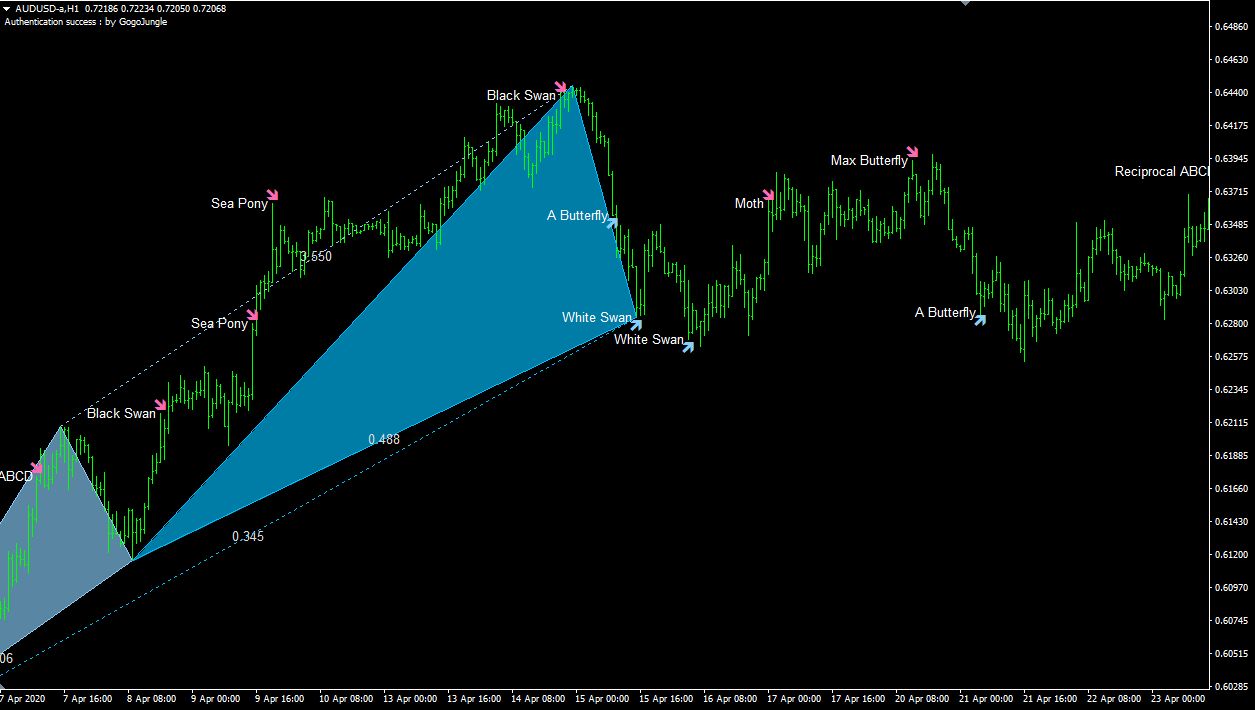
▲ Past patterns are drawn when the mouse hovers near the arrow. Even when multiple harmonic pattern signs appear,
Text + arrows only, so it won't get in the way!
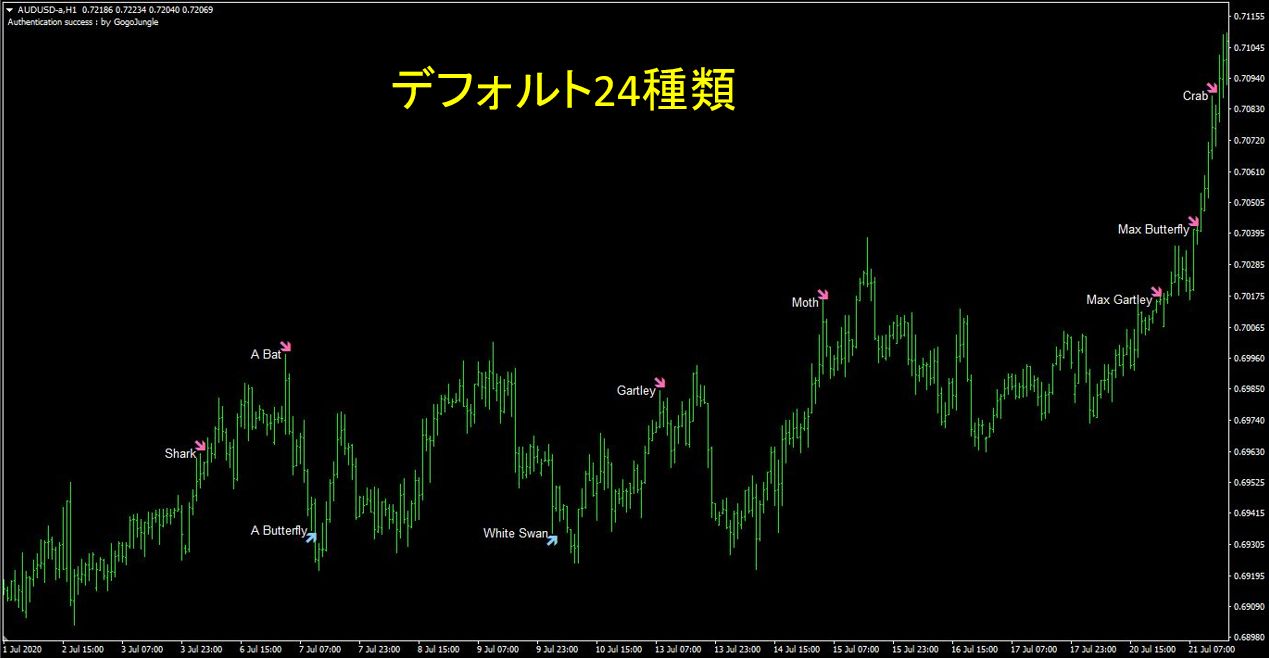
▲ By default, 24 types of harmonic patterns are recognized.
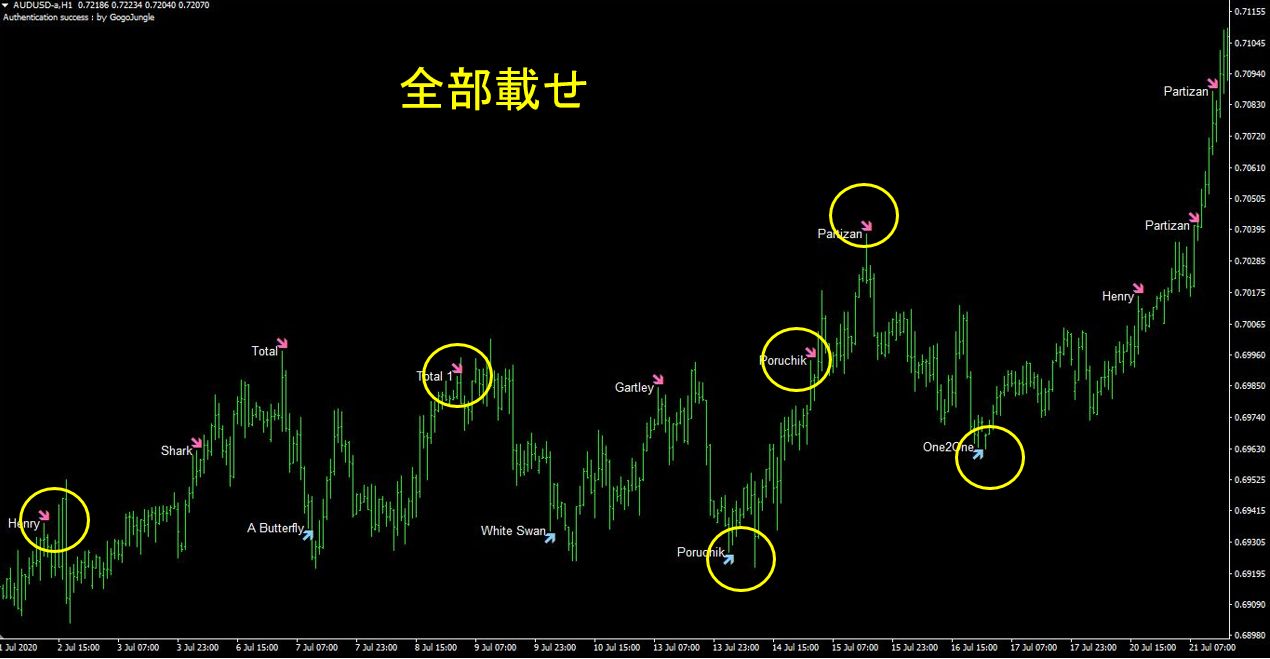
▲ When comparing all 46 types, including 13 basic patterns + 33 extended patterns.
Wouldn't you say that the contrarian signals are appearing at very favorable points?
Also, although there are many types of pattern recognition, they claim to filter out statistically unfavorable situations using their own pattern-selection algorithm.
Increase reversal probability by using TD Sequential together
The developer "Peaky FX" recommends using it together with the free indicator TD Sequential to check the pattern's accuracy.
TD Sequential is, simply, an indicator that counts the number of bars in a trend to indicate trend continuation; 9 signals the end of a short-term trend, 13 signals the end of a mid-to-long-term trend.
Since harmonic patterns are also for contrarian entries, the points where TD Sequential's 9 and 13 coincide could further improve reversal probability.
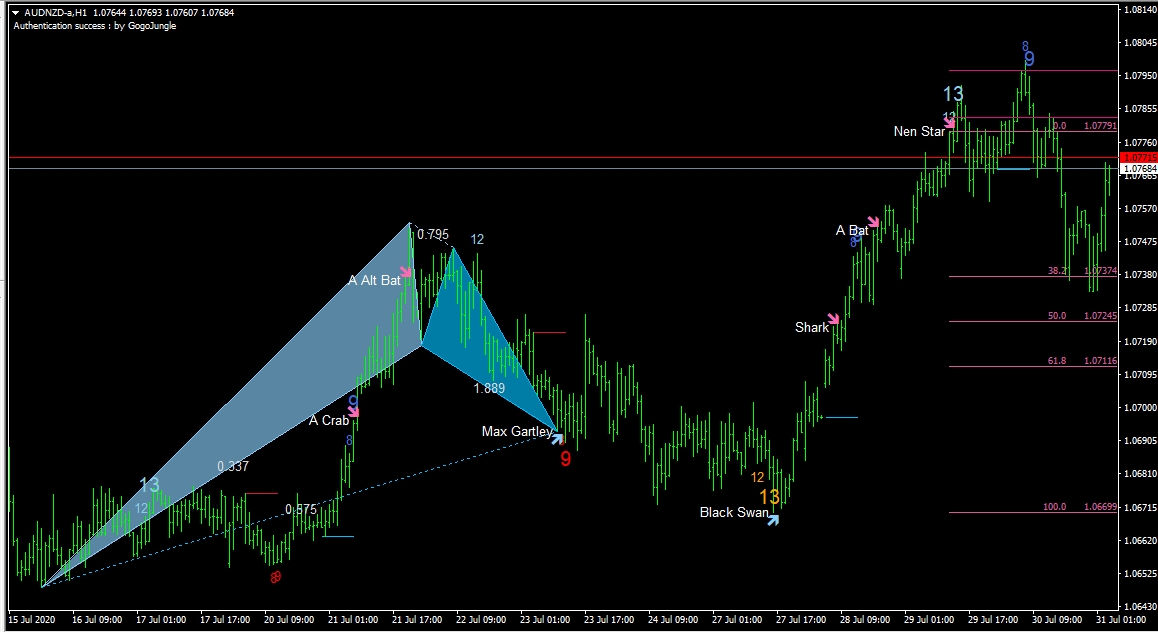
▲ When the appearance of TD Sequential 9 and 13 aligns with the harmonic pattern completion arrow signs, reversal probability goes up even more!
Also, it seems to pair well with horizontal line trading, line trading, etc. It would also be good if a pattern completion signal appears at a support/resistance turning line.
Even those who previously thought "Harmonic patterns seem difficult..." will surely soon feel how easy it is to use.

Using it together increases accuracy, and it's free


Written by Tera GogoJungle Marketing.