

Dow Theory perspective and entry method using RCI (Part 2)
Dow Theory PerspectiveandRCIusingentrymethod andstop-losssettings will be explained.
The chart below is the EUR/USD 15-minute chart.
MT4 indicators display “Dow Theory Trend Monitor”,”Dow Theory Perspective Signals”,”RCI3 Signals”.
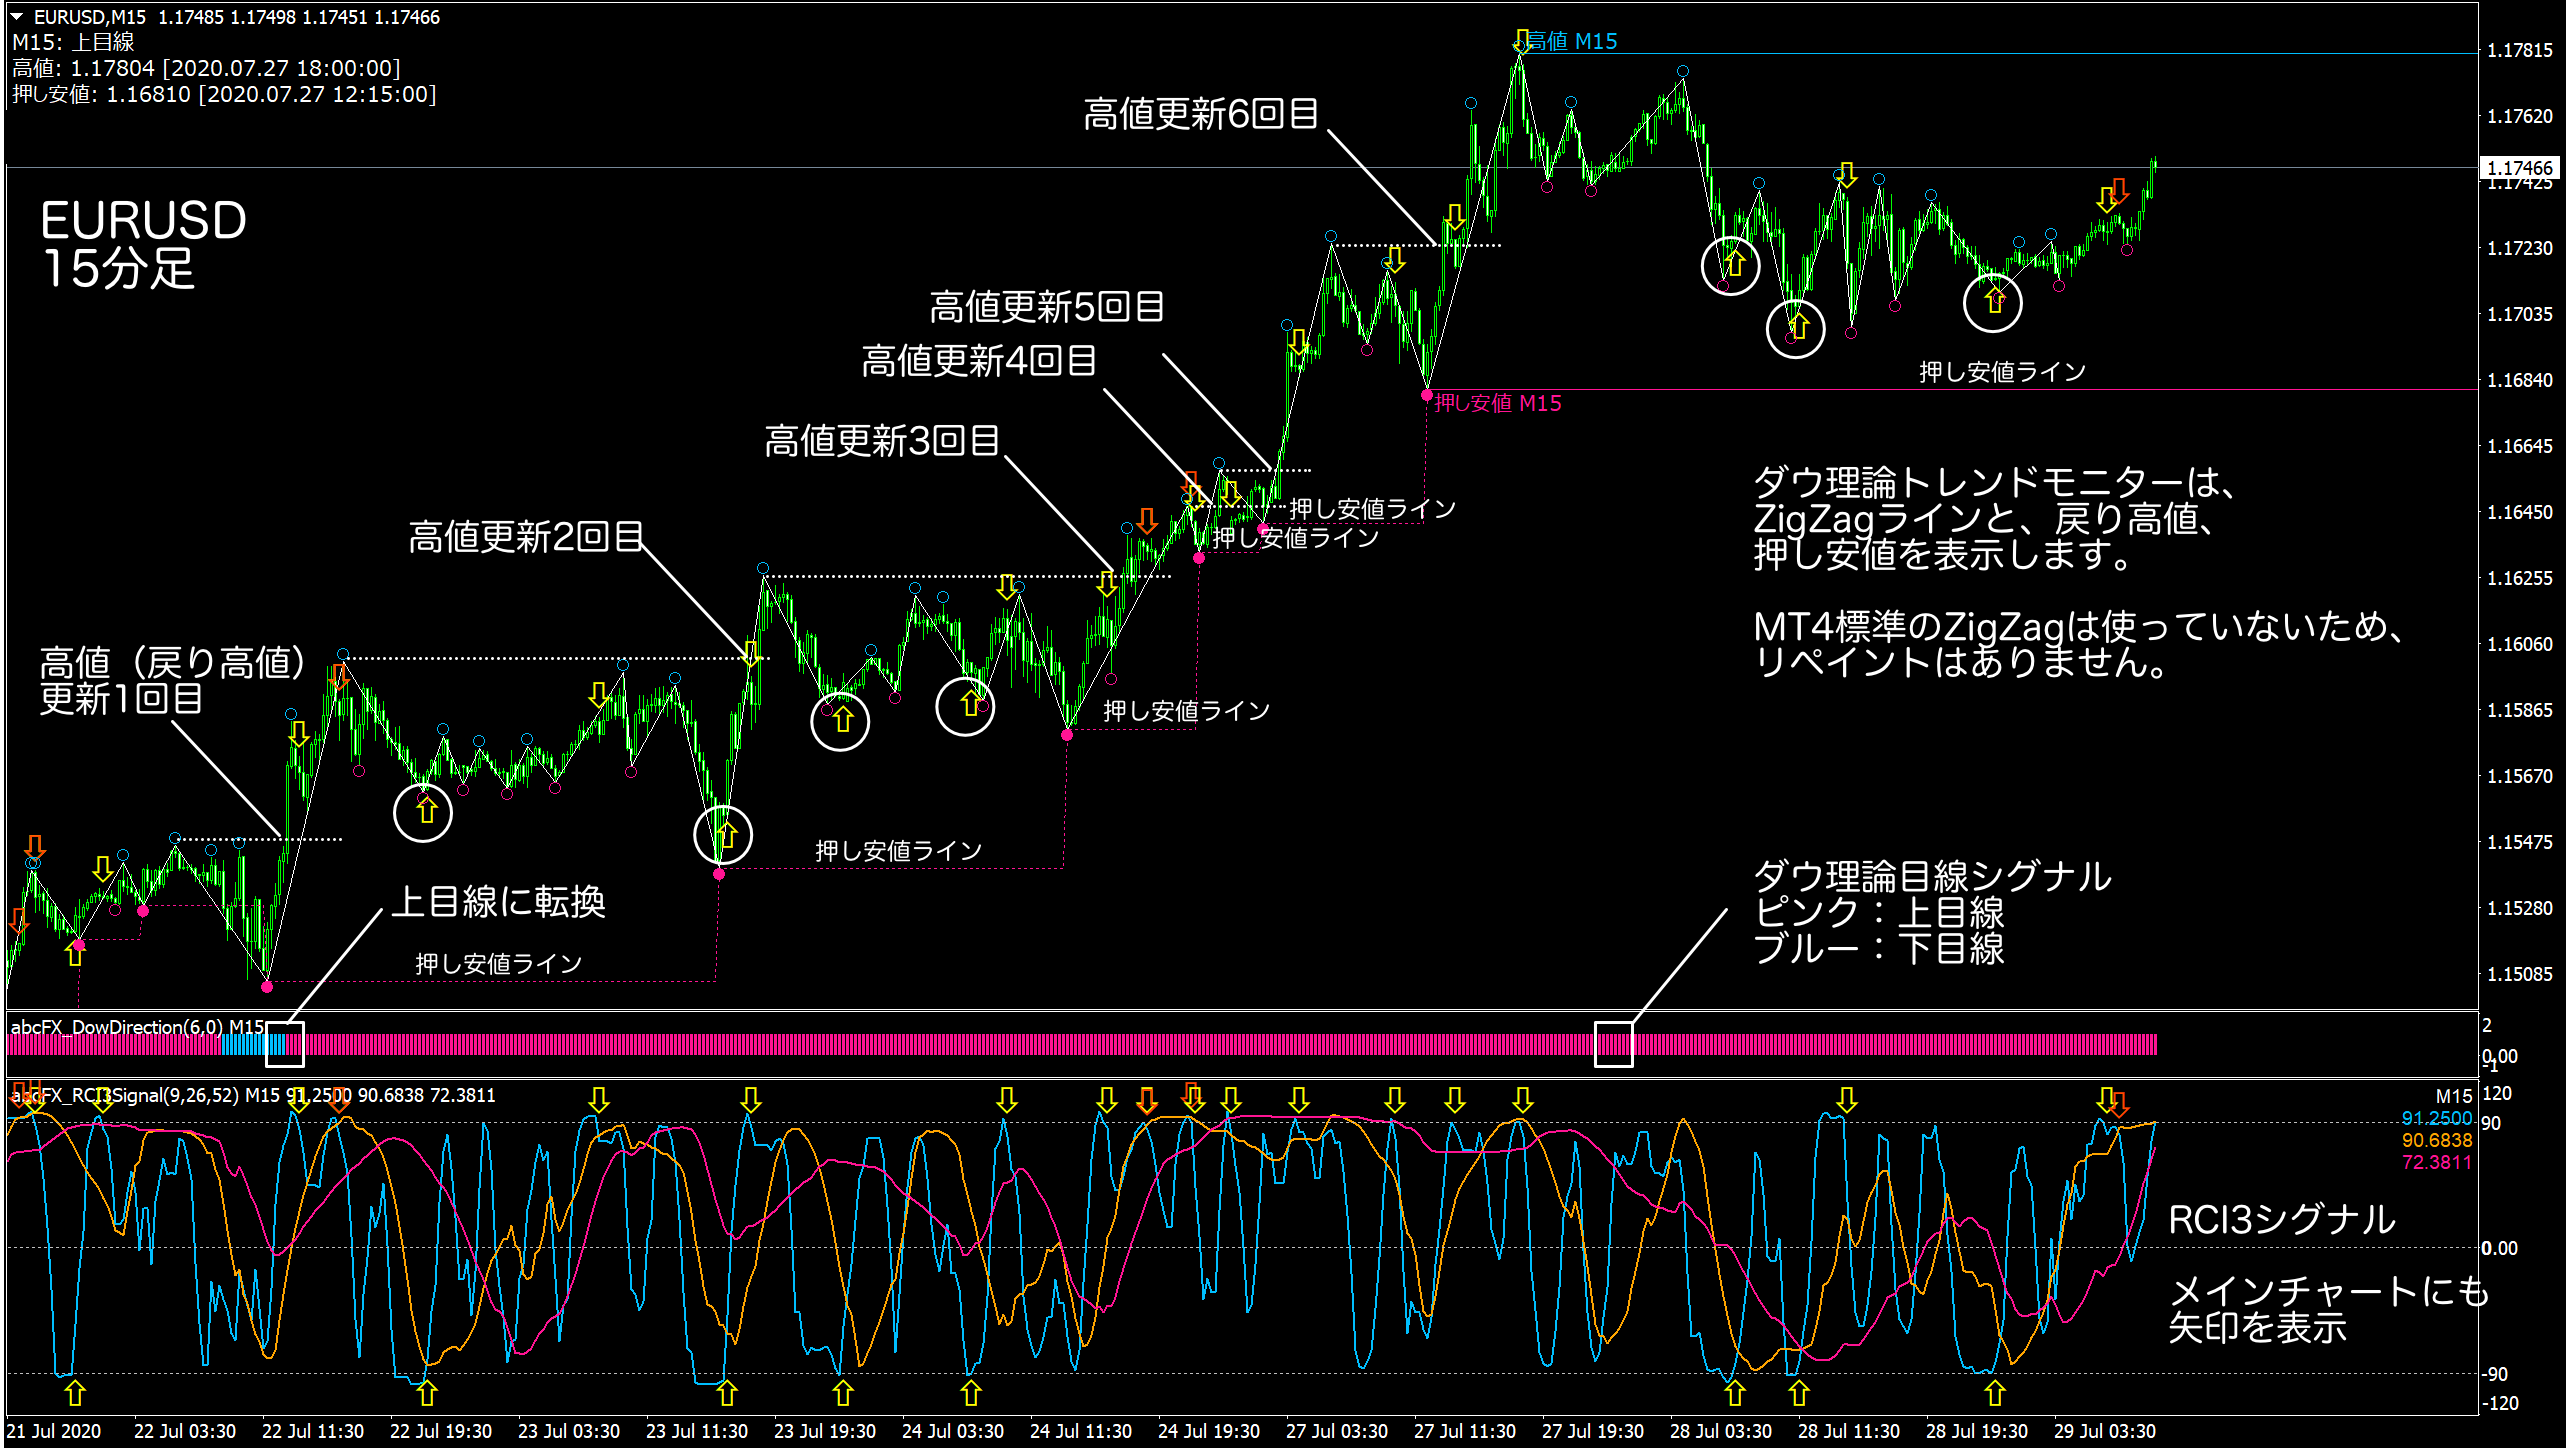
The lower sub-direction of the “Dow Theory Perspective Signals” is blue, and the upper sub-direction is pink.
The “RCI3 Signals” display arrows under the following conditions. The thresholds are default.
- Short-term RCI reverses direction from ± threshold (yellow arrow)
- Short-term RCI and mid-term RCI GC and DC(1) (orange arrow)
The arrows for “RCI3 Signals” appear when the conditions are met at the closing price of the confirmed bar.
At the left side of the chart, a retracement high was broken and the perspective shifted to bullish.
After that, the price formed higher highs and higher lows for six consecutive bars, creating an uptrend.
To enter long in this state,take timing from the upper arrow of the short-term RCI (end of pullback).
Stop-loss isplaced below the swing low.
Since an uptrend consists of higher highs and higher lows, the stop-loss does not get hit.
If the price falls below the swing low, the perspective will shift, making for a rational stop-loss placement.
To protect profits, take partial profit near the high.
By using the “RCI3 Signals,” you can, at the timing of the arrows,send a screenshot of the chart via LINE and emaileven when you are away from the computer, so you won’t miss opportunities.
MT4 Dow Theory Perspective Signals