

Dow Theory perspective and entry method using RCI (1)
Daw theory perspectiveandRCIentry method validation.
The chart below is the USD/JPY 1-hour chart.
In MT4, indicators display “Dow Theory Trend Monitor,”Dow Theory Perspective Signals,”RCI3 Signals.”
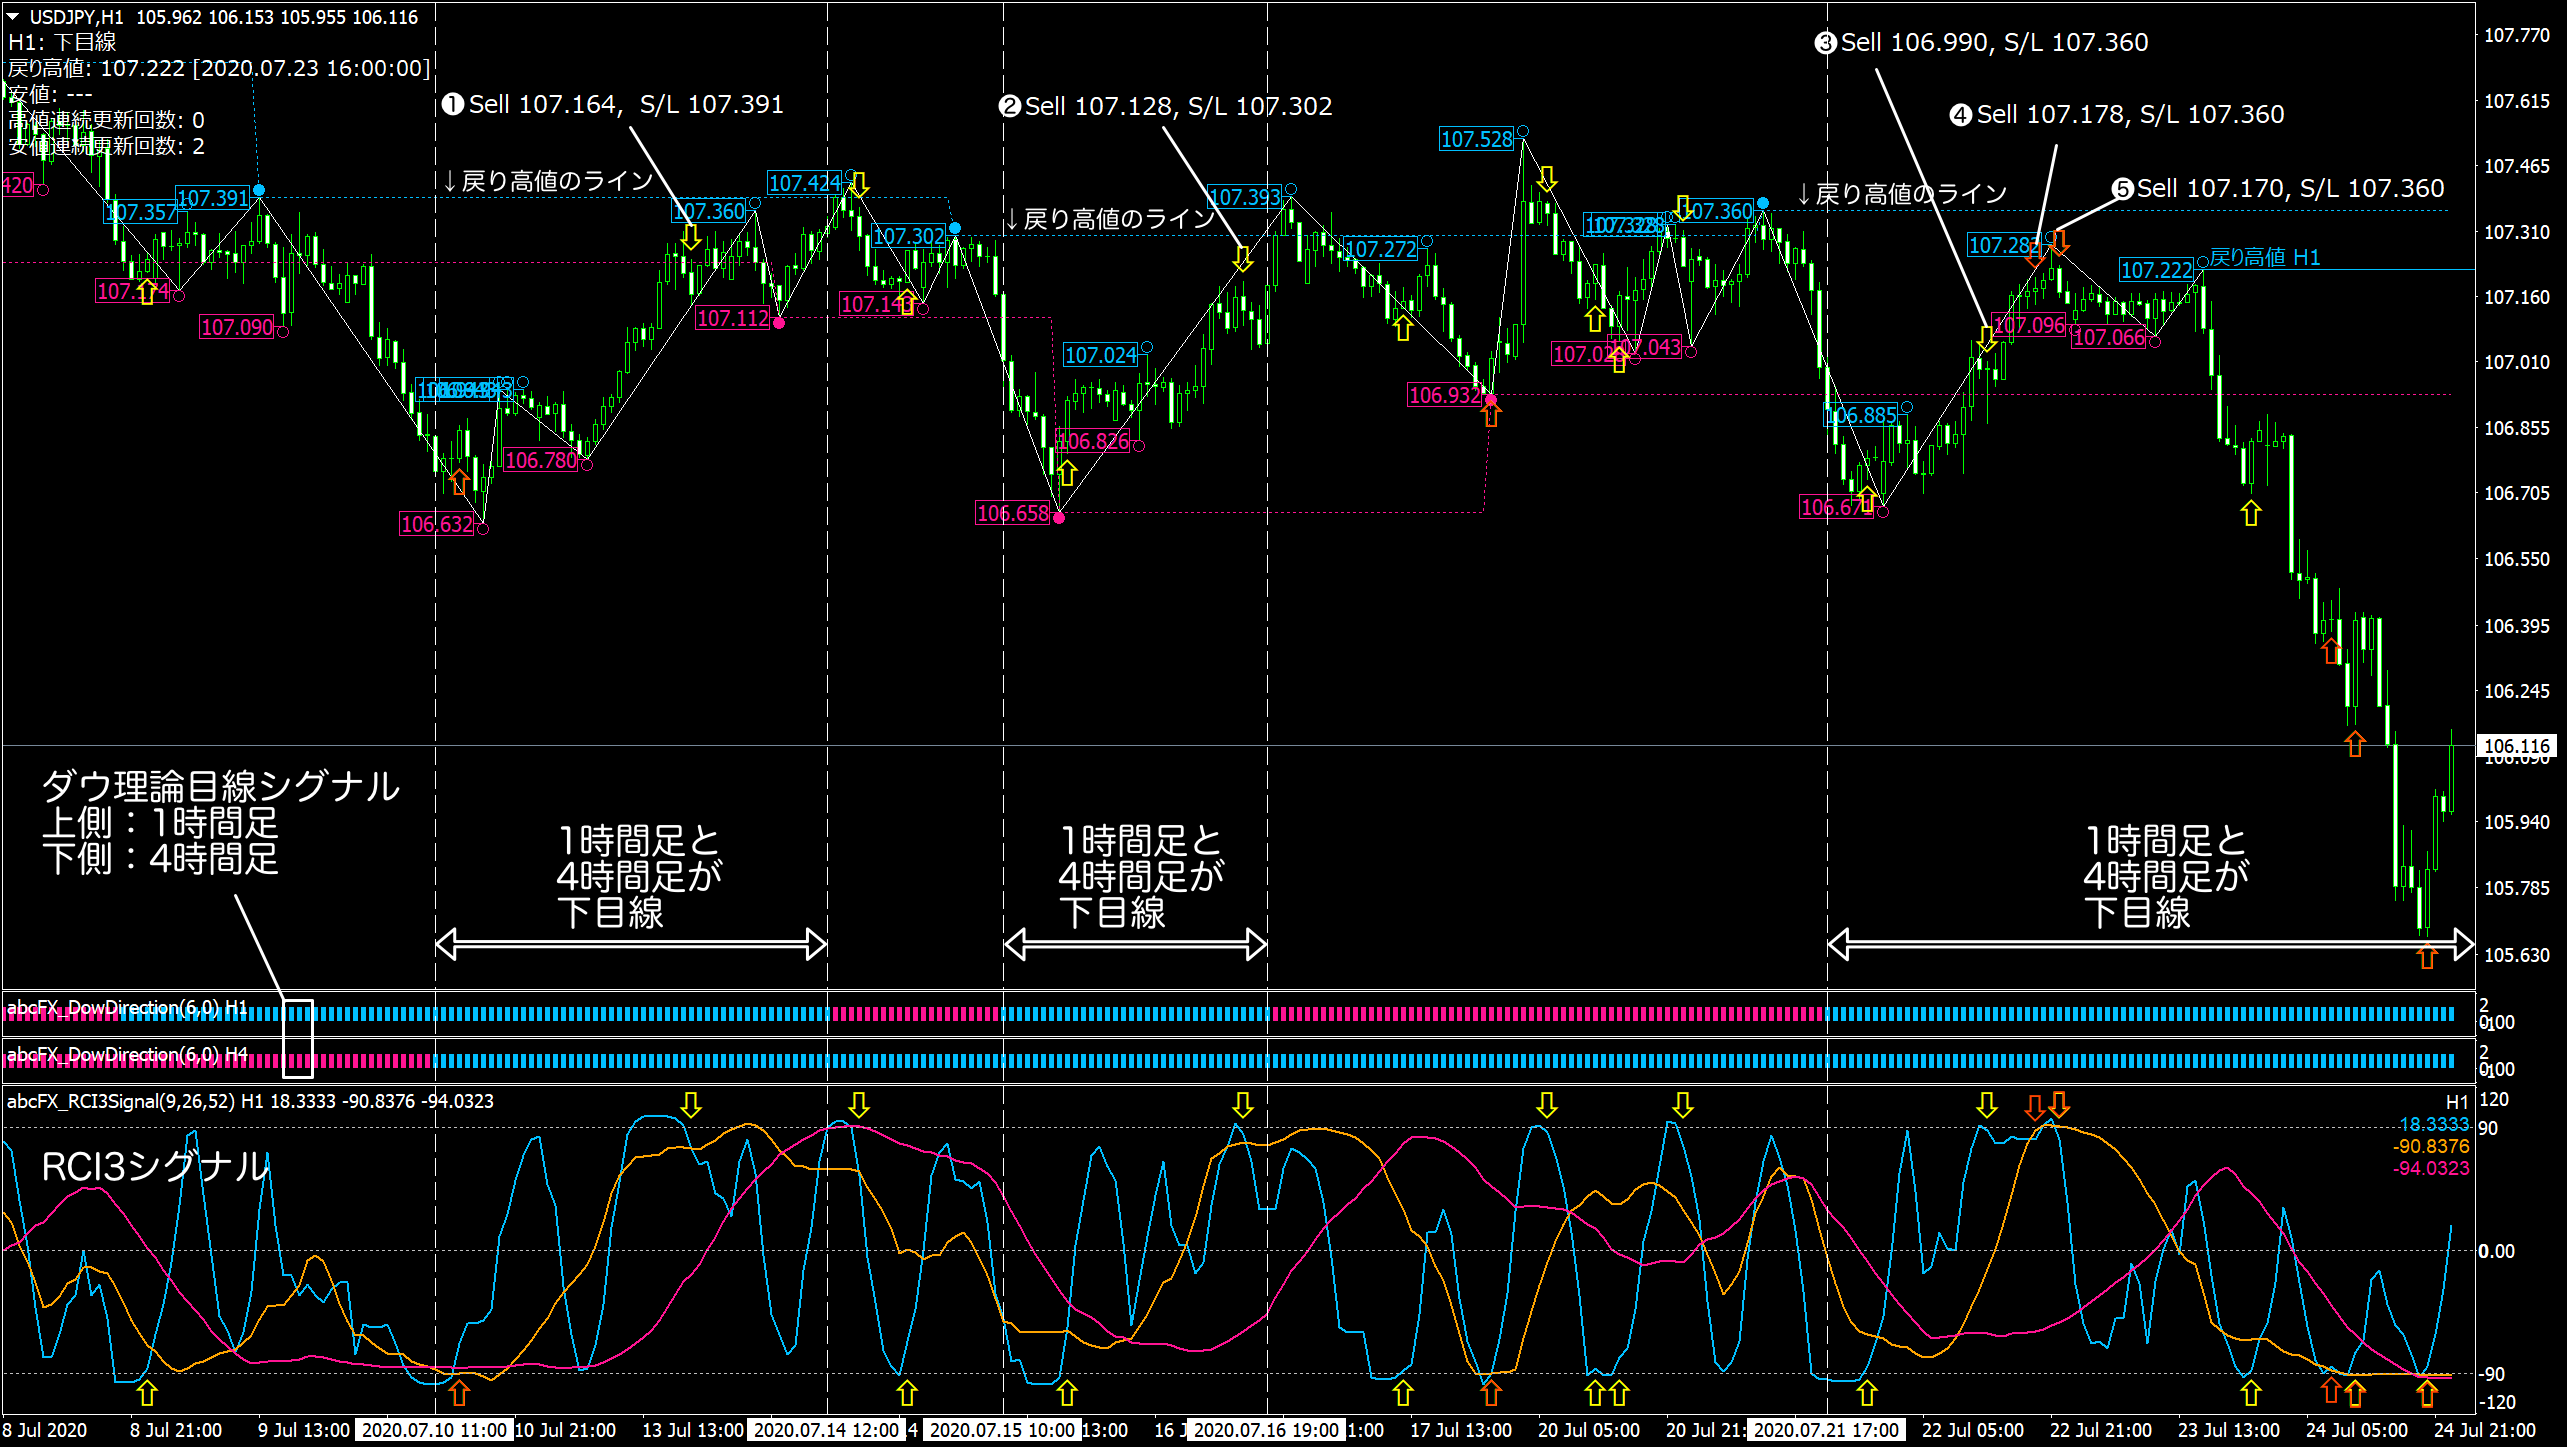
The “Dow Theory Perspective Signals” display the perspective of the 4-hour chart in MTF. The lower perspective is blue, and the upper perspective is pink.
The “RCI3 Signals” show arrows under the following conditions. The threshold is default.
- Short-term RCI reverses direction from the ± threshold (yellow arrow)
- Short-term RCI and mid-term RCI GC and DC(1) (orange arrows)
The “RCI3 Signals” display an arrow when the condition is true at the close of a completed bar.
Direction of the arrows,and when the 1-hour and 4-hour perspectives all align, entry is taken.
On the chart, the 1-hour and 4-hour perspectives are both downward, so a short entry is made with a downward arrow.
Stop loss (S/L) is set above the retracement high for a short position, and below the retracement low for a long position.
On the chart, the S/L is shown at the retracement high for clarity.
All five short-entry instances where the conditions were met on the chart did not hit the stop loss,and ultimately ended in a profit.
MT4 Dow Theory Perspective Signals