The importance of the horizontal line is shown as a numeric value! Automatic horizontal line drawing indicator
Horizontal-line analysis of charts has now become a major method for recognizing the market environment.
Draw horizontal lines on price ranges where price has been repeatedly halted on the daily, 4-hour, and 1-hour timeframes, and change the color for each timeframe…
This is a common method.
Tools that automatically change the color of horizontal lines for each timeframe are also popular, but
there are handy tools for those who are not confident in drawing horizontal lines or who find it difficult to draw horizontal lines across multiple currency pairs!
Expressing the degree of importance with a proprietary numerical value
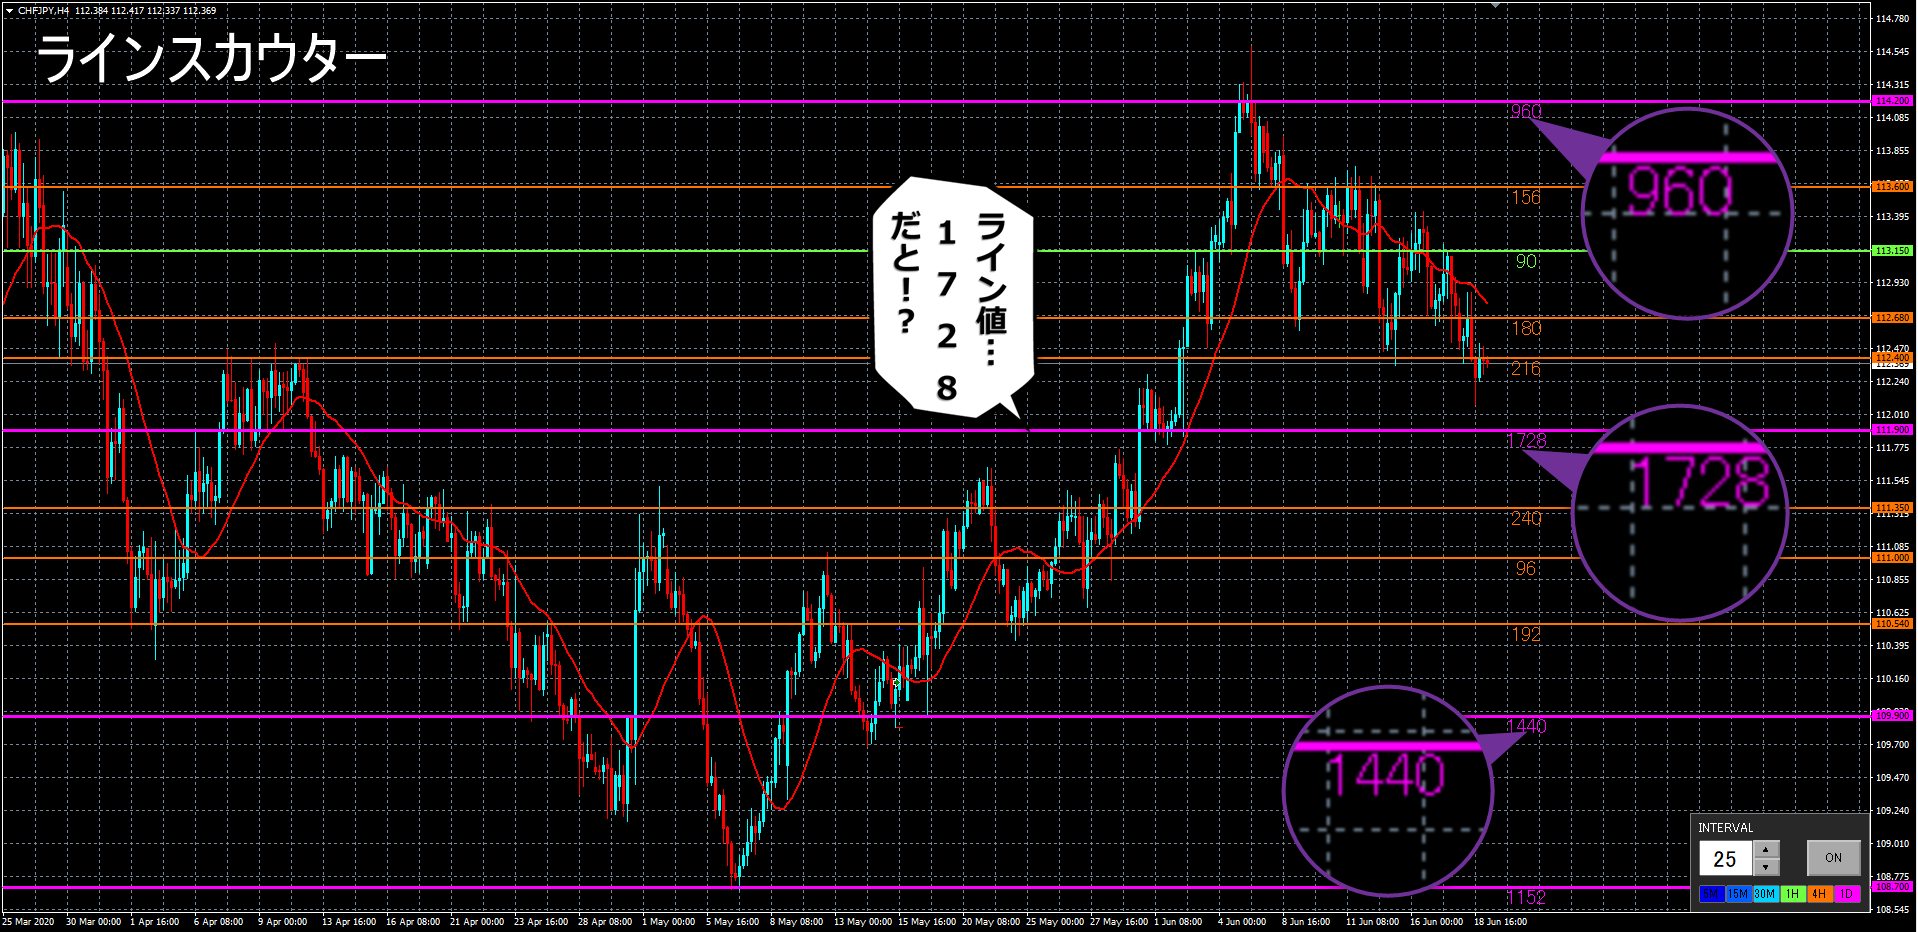
Horizontal lines are automatically drawn in colors by timeframe: daily, 4-hour, and 1-hour.
(Horizontal lines are drawn up to two timeframes below the displayed timeframe)
Also, the numbers displayed for each line are an index of points where price action is paused and points with many support levels,you can gauge the line's importance.
Easily toggle display intervals and ON/OFF with buttons
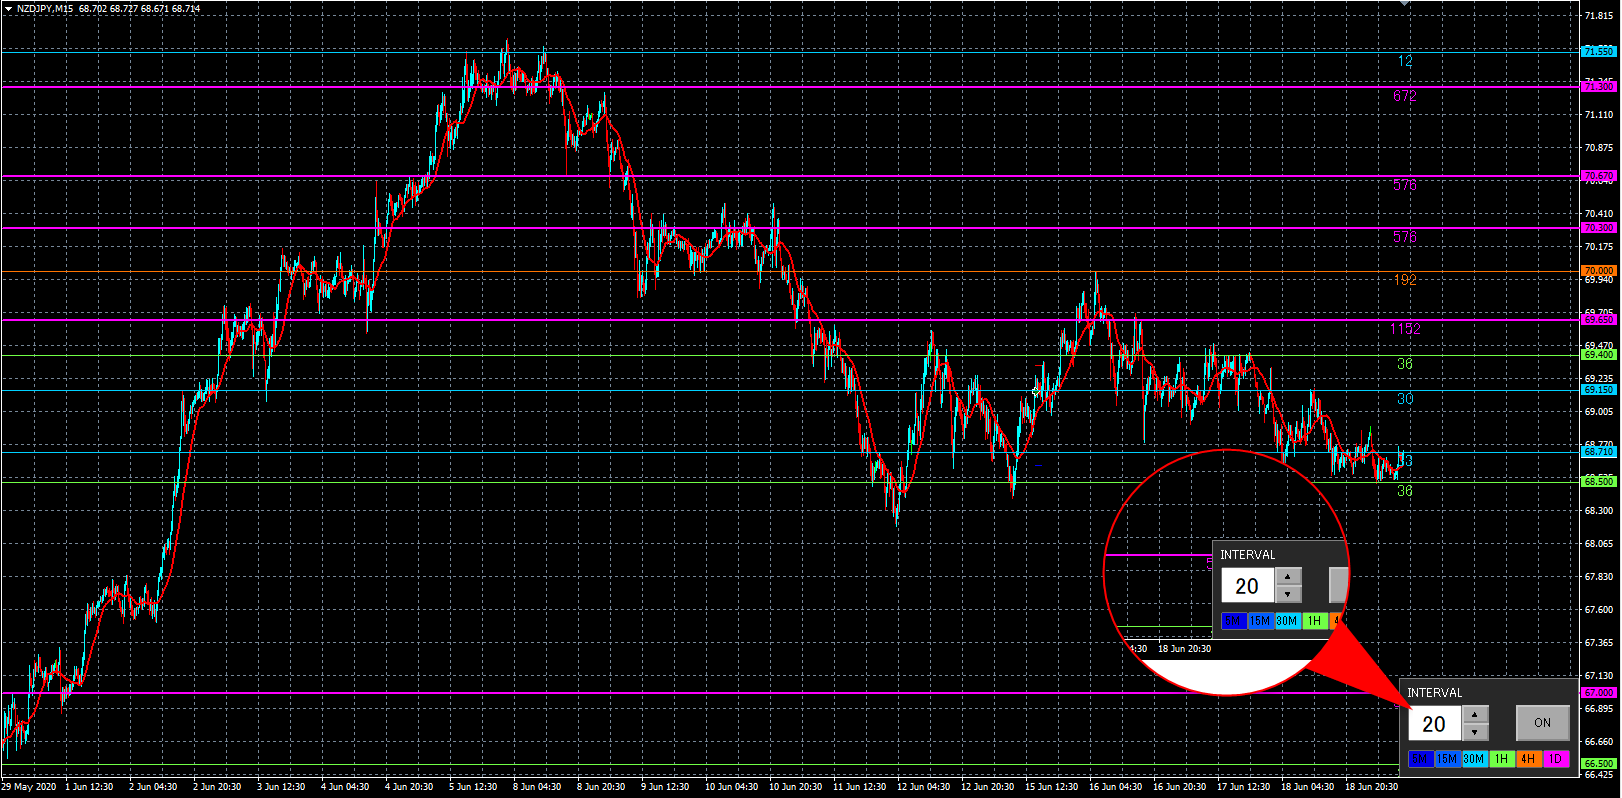
In the panel at the bottom-right of the chart, you can change the display interval of horizontal lines (Pips) to prevent showing lines with intervals that are too tight.
Also, with a single ON/OFF button you can turn the horizontal lines off on the chart.
Since other indicators can make things cluttered, this feature is quietly convenient, isn’t it?
There is a trial version available that can be used until July 31, 2020
▼ Line Scouter Trial Version (available until 2020/7/31)

▼ Line Scouter Main
Special price until 7/31
¥5,800 (tax included)
Written by Tera GogoJungle Marketing.