

Forecasting market bottoms with MT4 "Cycle Theory Candlestick Counter"
Cycle theory regards cycles as measurable phenomena that recur at regular intervals.
Raymond A. Merriman, who coined the term “,” is a globally renowned analyst for applying market cycle analysis to astrology.Cycle Theory
The book is “The Basics of Market Cycles: Merriman Cycle Theory” (First published November 4, 1995, Investment Daily Publishing).
Concepts of Cycle Theory
Here is how it is applied to the market.
A cycle is the period from a price low to the next price low.
In other words, the sequence “bottom — top — bottom” constitutes one cycle.
Cycles rarely align perfectly; the acceptable range is called an “orb.”
The probability of a cycle occurring within this orb is about 80%.
Cycle theory analyzes when the next low will come under the premise that cycles occur with an 80% or higher probability.
We target market turning points through cycle analysis.
In general, the orb of a cycle is one-sixth of its length.
Therefore, a 6-week cycle has an orb of about one week on either side, so effectively it is 5–7 weeks.
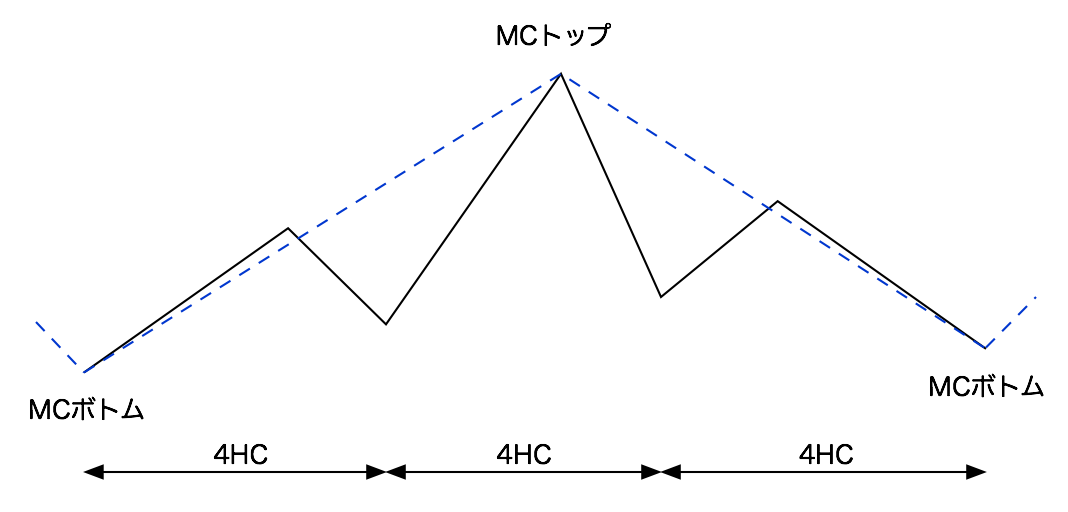
There are various types of cycles: the basic cycle is the Primary Cycle (PC), the short-term cycle is the Major Cycle (MC), and the ultra-short-term cycle is the Trading Cycle (4HC).
Smaller cycles exist within larger cycles.
This is an actual chart of the USD/JPY daily from March 25 to May 13, 2019.
There are 3 Trading Cycles (4HC) within the MC.
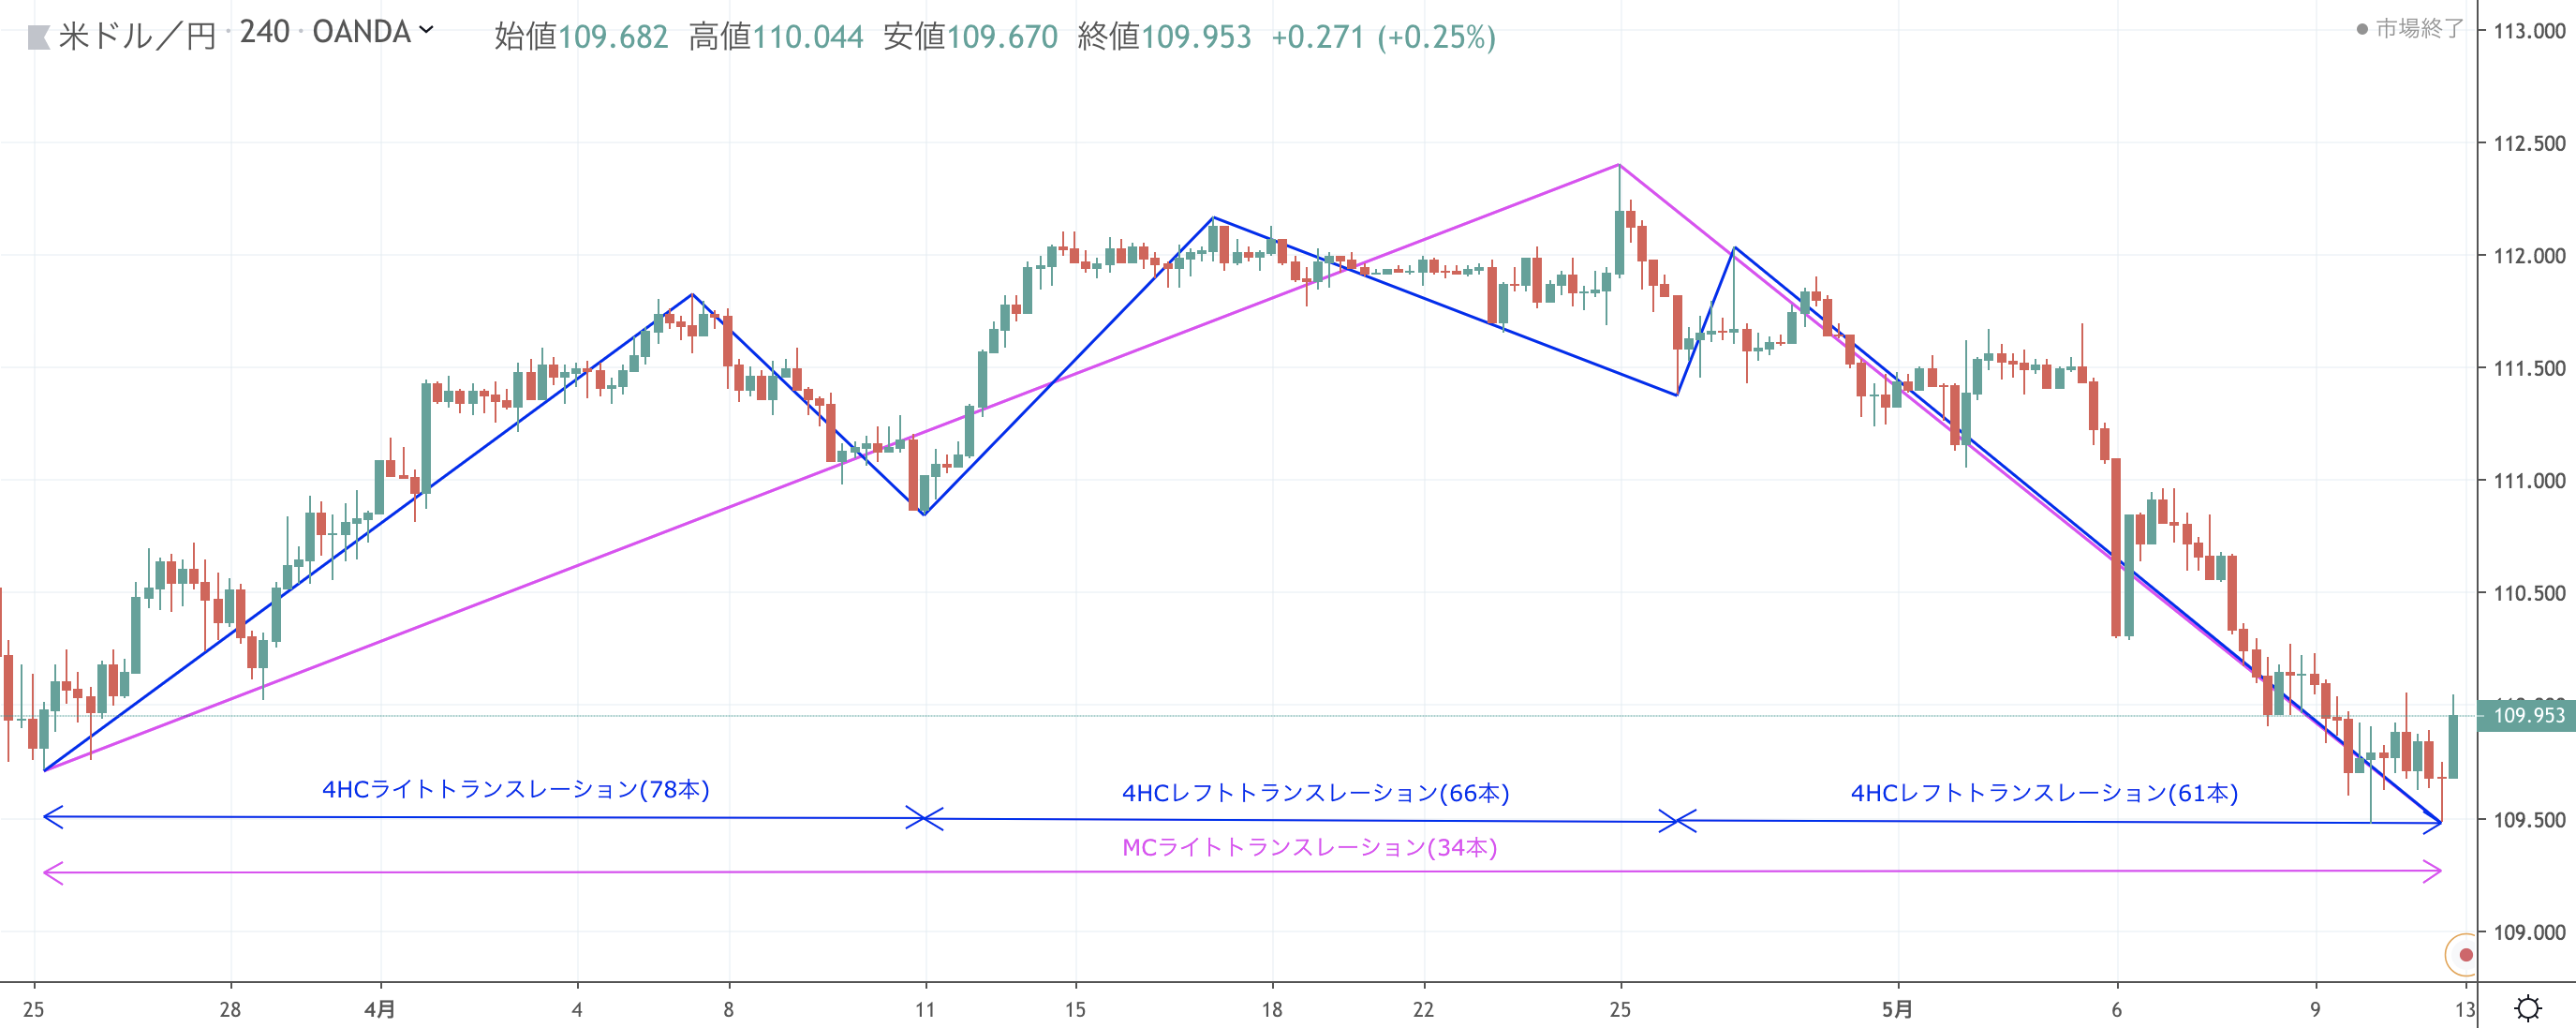
The lengths of the cycles are as follows:
Primary Cycle: counted on a weekly chart, 18–22 bars make one cycle
Major Cycle: counted on a daily chart, 35–45 bars make one cycle
Trading Cycle: counted on a 4-hour chart, 60–80 bars make one cycle
The above cycles differ in length from those described in the book:The Basics of Market Cycles: Merriman Cycle Theory.
Since the book lists lengths as of 1994, this page provides the generally accepted current lengths.
Counting Candlesticks
Counting candlesticks starts with the first bottom as the 1st bar.
Using the MT4 indicator “Cycle Theory Candlestick Counter” makes counting candlesticks easy.
There is also a feature that automatically follows the latest candlestick, so you can always see the most current count.
Count cycles for various currencies and aim for market turning points.
Bull and Bear Markets
A bull market is called a “Light Translation,” and the top B appears after the midpoint between the lows A and C.
The bottom (C) of the cycle exceeds the bottom (A) of the previous cycle.
The top (B) exceeds the top of the previous cycle.

A bear market is called a “Left Translation,” and the top B appears before the midpoint between the lows A and C.
The bottom (C) of the cycle is below the bottom (A) of the previous cycle.
The top (B) is below the top of the previous cycle.


By counting candlesticks and determining whether the top is before or after the midpoint, you can tell whether the next bottom will fall below or rise above the previous low.
Note, however, that cycles can be distorted, with shortened or extended durations, or during Light Translation the bottom of a cycle may fall below the previous cycle’s bottom, so exceptions can occur.
In a bull market, go long at the bottom; in a bear market, go short at the top.
【Link to blog indicator page】
【GogoJungle download page link】