Market environment recognition and making entry decisions at pullback lows and retracement highs — "MT4 Dow Theory Set"
For market environment recognition and entry/exit decisionsMT4 Dow Theory Set has become popular.
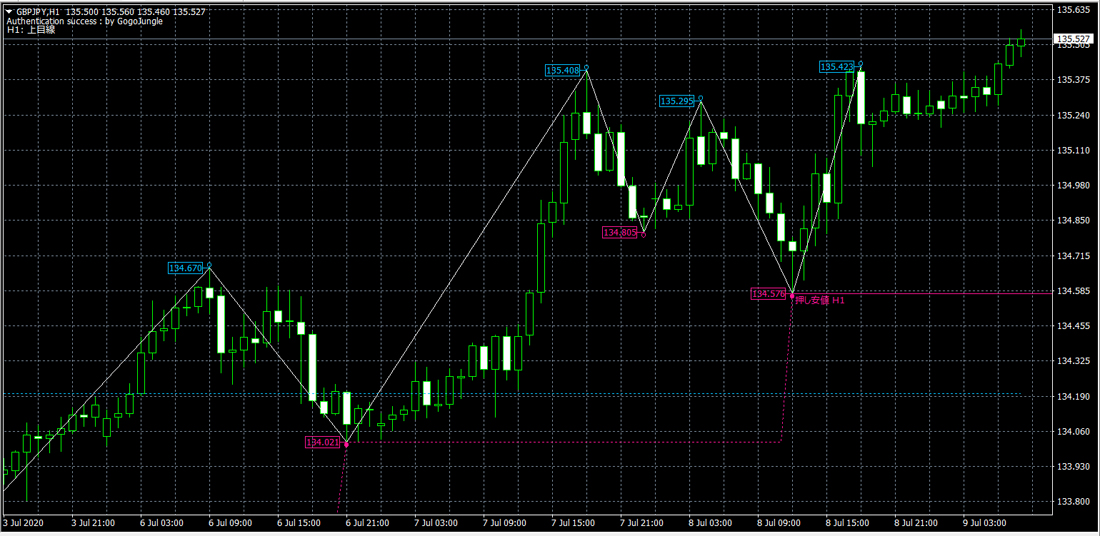
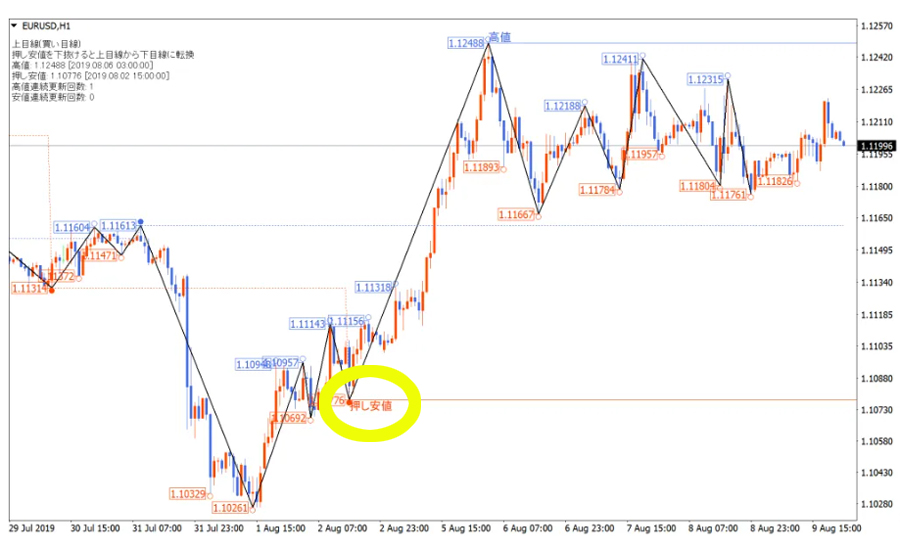
When you actually display the Dow Theory Trend Monitor from the Dow Theory Set on a chart, you will see swing lows, retracement highs and ZigZag lines, making the trend direction easier to identify. In the figure below, the swing low is displayed.
An uptrend is defined as a situation where highs and lows rise, and conversely, a downtrend is defined as a situation where highs and lows fall.
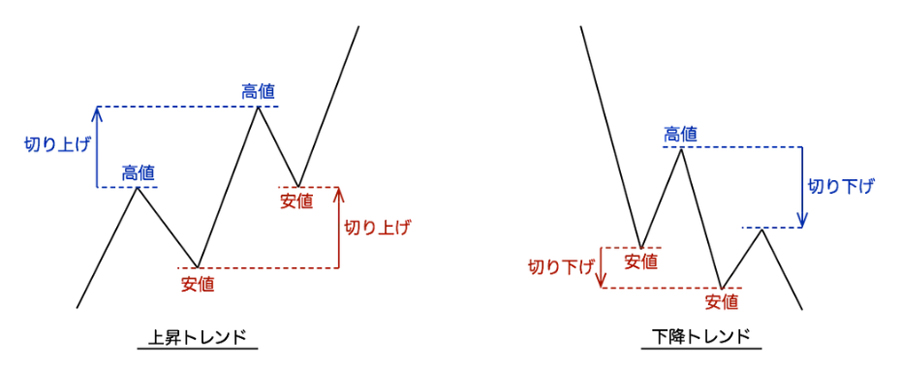
The determination of highs and lows uses the concept of the fractal technical indicator.
This is a method of looking for a candle with N bars on both sides that have lower highs and higher lows. For example, as in the figure below, if six highs and lows occur on the left and right, the central candlestick is displayed as Swing High if it is a high, or Swing Low if it is a low.
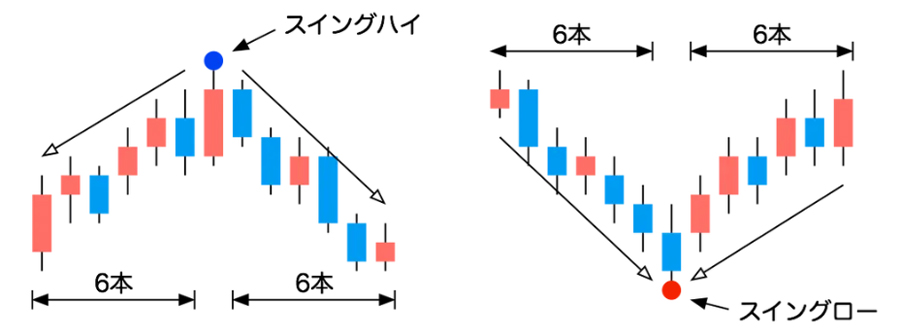
Lower highs, higher lows, recognize swing highs and lows, and use pullback lows and retrace highs for entries; however, during the upward trend shown in the figure below, when a pullback low appears, it can be regarded as an entry opportunity.
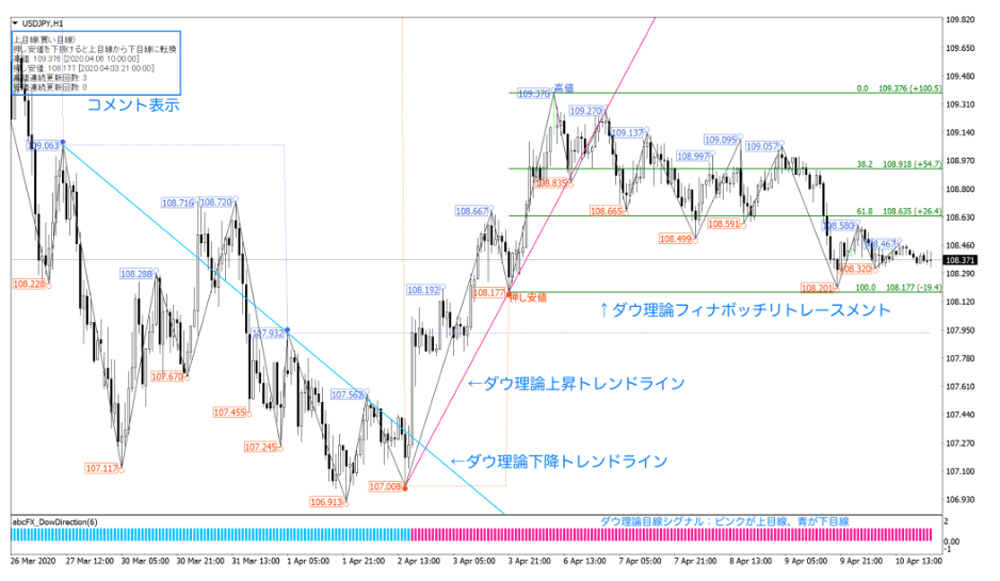
MT4 Dow Theory Setincludes,MT4 Dow Theory Perspective Signals andMT4 Dow Theory Trendlinesare included, and I would like to provide one example of a trading method using them.
 and
andThe light blue and pink MT4 Dow Theory Trendlines shown in the figure below.
When the candle is to the left of the pink rising Dow Theory Trend Line, we judge that the uptrend is continuing and we buy on pullbacks as it approaches the trend line.
If the candle breaks through the pink rising Dow Theory Trend Line, you can interpret it as entering a range-bound market.
Written by Hayakawa