

Recent spreads have shown even better performance?! Panda-C_PRO_USDJPY with an annual rate of 20.62%
The crown for what is probably this year's most popular hit so far isPanda-C_PRO_USDJPY_M15, I think; we have also started recording real account activity.

The same account also includesLegato USDJPY, but the first trade wasLegato USDJPY, and Panda-C_PRO_USDJPY_M15 has not yet been traded.
There are quite a few EAs where backtests using Tick Data Suite's variable spread do not necessarily reproduce in actual forward tests; conversely, I believe there are no exceptions that an EA which performs well in long-term forward tests will have poor backtest results.
So, this time as well we ran 17 years of TDS backtest results through Quant Analyzer.
In the description on the EA page
Features:
①Profit secured by a high win rate of 88.67%
②About 1.1 trades per day
③No positions are held over weekends, so there is no risk of losses from major weekend news.
④The setup is very simple, so it can be used by both EA beginners and veterans alike.
⑤It is developed to operate using only the opening price to minimize discrepancies with forward tests, so you can expect profits close to the backtest.
That is how it stands.
There is no description of the logic, but it states “operates only on the opening price,” so you can expect forward tests to be close to the backtest results.
Now, I would like to look at the analysis results.
The base data for the backtest is,Panda-C_PRO_USDJPY_M15 20037 Gogojungle TDS Backtest, used
Spread: variable
Changes in the parameters are
lot: 1.0 lot (initial value is 0.1 lot.)
RISK = 9
That’s it.
As mentioned in the previous article, we looked into the spreads used by Ducascopy that TDS uses,NEET's blog on FX automated tradingsays
every five years since 2005
20051.61→20101.01→20150.41→20190.37(pips)
and it has been narrowing. With this spread evolution in mind, I would like to examine the backtest results.
The unit is dollars, but the data used are yen-based values, so please convert to yen.
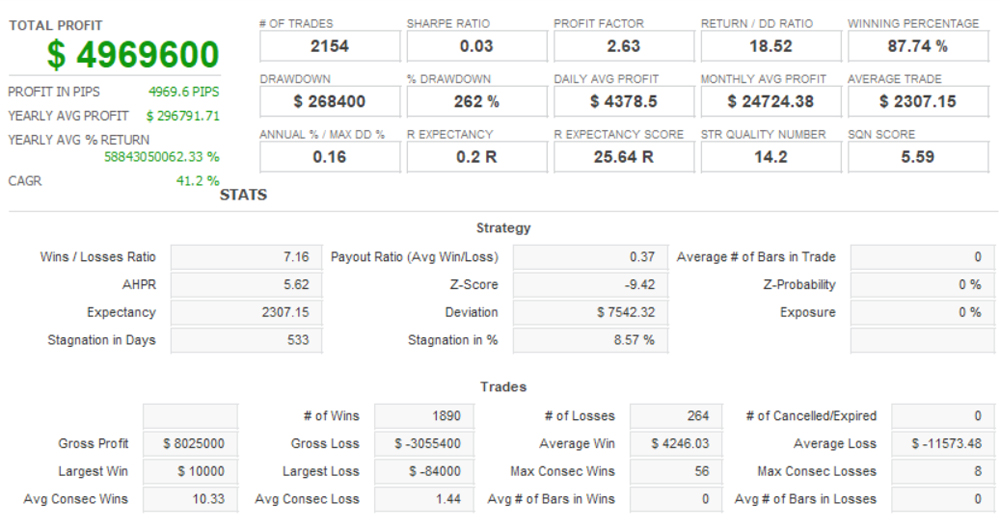
Annual average profit: ¥296,791
Monthly average profit: ¥24,724
Annual return: 20.62%
Win rate: 87.74%
Annual average number of trades: 126
Average profit per trade: ¥4,246
Average loss per trade: ▲¥11,573
This is the result.
Monthly status

There are very few losing months.
As mentioned above, the Ducascopy USD/JPY spread used in the backtestisevery five years since 2005
20051.61→20101.01→20150.41→20190.37(pips)
and it has narrowed.
Looking at the above Monthly Status, since 2014 the months with losses have become extremely rare, suggesting that the current spread environment yields a viable logic.
Annual status
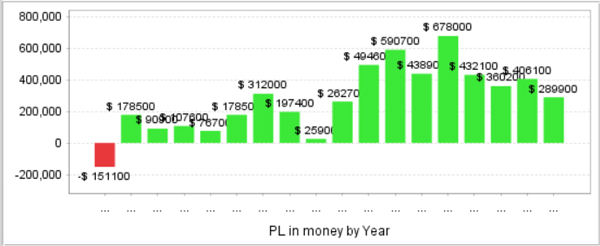
If you look at the annual results in a bar chart, it becomes even clearer.
【What are the recommended margin and return?】
The formula for the recommended margin (assuming 25x leverage) used in GogoJungle's System Trader performance measurement is
1万通貨単位×取引通貨の日本円レート÷25倍×ロット数平均÷0.1×最大ポジション数+最大損失(バックテストの最大ドローダウンを採用)×2
Therefore,
¥1,070,600(本日のレート)÷25÷0.1×2ポジション + ¥291,100(最大ドローダウン)×2
The recommended margin is ¥1,438,680.
On the other hand,annual average profit is ¥296,791, so the expected annual return is 20.62%.
To reiterate, this value comes from backtests conducted across spreads that narrowed every five years from 1.61 → 1.01 → 0.41 → 0.37 (pips), including wider spreads such as 1.61 pips.written by Hayakawa


