

An indicator for "DiNapoli's Single Penetration" that captures trend pullbacks and takes pips with a high probability
To avoid stumbling in trading from the outset, isn’t copying a highly reliable method that yields profits the quickest way?
This time we focus on the trading method known as “DiNapoli’s Single Penetration,” and we’ll also introduce indicators that make that trading method considerably easier.
What is DiNapoli
Joe DiNapoli... a world-renowned trader with more than 30 years of trading experience. He is a leading figure in Fibonacci-sequence-based investment strategies.
“DiNapoli’s Secret Numbers” is a popular book published in Japan as well.

What is Single Penetration
The one we are introducing this time is one of DiNapoli’s trading methods, called “Single Penetration.”
In short, it’s a method that captures pullbacks and retracements in momentum-driven trending markets, enters in the direction of the trend, and takes profits early to reliably net pips.
Fibonacci is used to compute these pullbacks and profit targets.

Rules
Indicators UsedDMA (3×3)
A 3-period moving average plotted 3 periods ahead.
ConditionsThe close price moves away from the DMA and goes up or down, continuing for eight or more bars (a thrust state), and when the close price again breaks below the DMA, the setup begins.
Entry, Take Profit, Stop LossIn a downtrend, draw Fibonacci from the high to the low at the thrust’s start and end points.38.2% retracement is the entry line, 61.8% price is the stop-loss lineThis is how it works. Take profit is drawn anew from the thrust end’s low toward the 38.2% retracement.The 61.8% price level of the rise becomes the take-profit line.
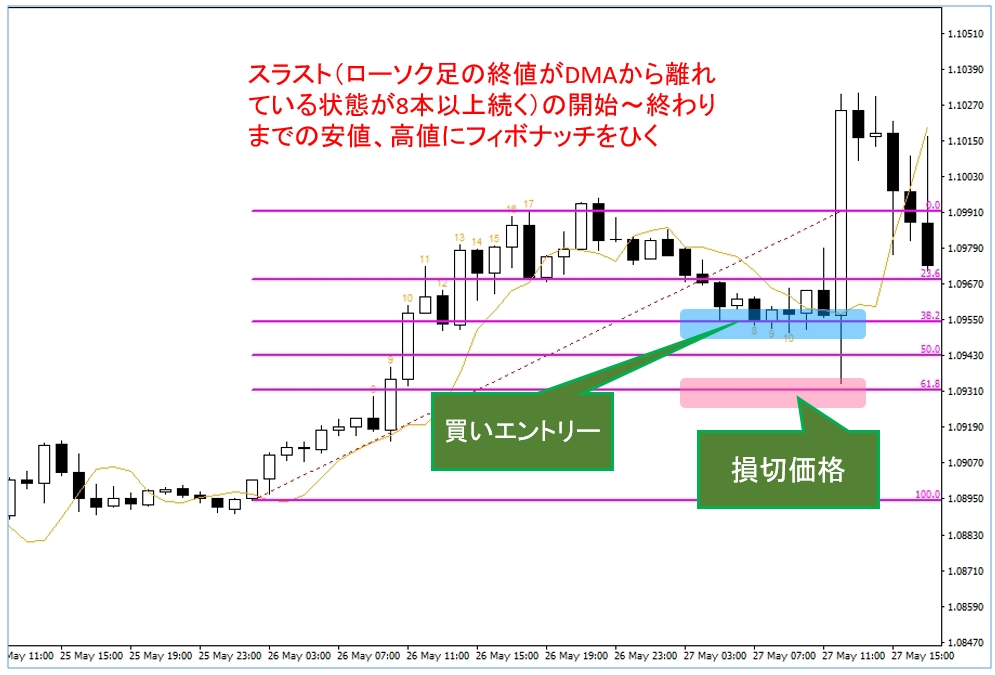
▲Fib levels are drawn from the thrust’s start to end based on the lows and highs. The 38.2% retracement is the entry, and 61.8% is the stop-loss price.
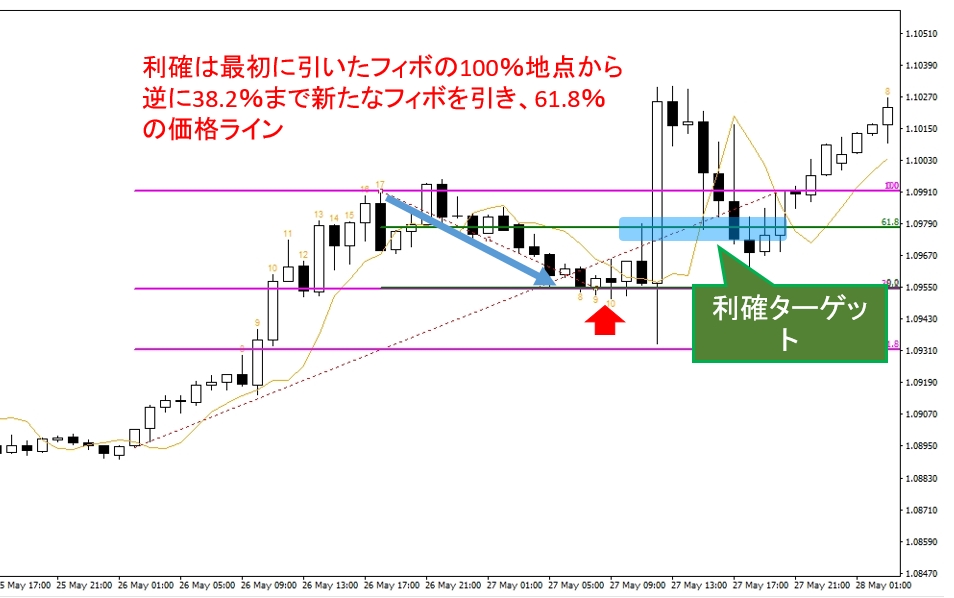
▲Take profit is drawn anew from the initial Fibonacci’s 100% toward 38.2%. The 61.8% line becomes the take-profit line.
As you can see in the image, during a trending market pullback it’s wide, and profit is taken on the assumption that the trend may continue.
Since the price range can allow you to take profit even if the trend reverses, don’t you think there’s a solid chance to reliably capture pips?
DiNapoli’s Single Penetration is, technically, solid, with an edge and good reproducibility.
Of course there are cases where the price does not pull back to 38.2% and heads back into the trend, or conversely breaks the 61.8% stop-loss line causing a trend reversal.
Also, because this is a method that targets small price moves within a trend, on charts of 1 hour or higher you can expect to take 20 pips or more per trade.
While it is a reliable method, putting it into practice can be quite tedious.
Counting thrusts, drawing Fibonacci, and drawing the take-profit Fibonacci again... the next indicator eliminates all that hassle at once.
Automatic Fibonacci & Entry Signals Single Penetration Indicator
‘MT4 DiNapoli Method “Single Penetration”’ is.
This indicator includes the following features.
■ Displays a count on the candlesticks when thrust reaches 8 or more
■ Displays Fibonacci retracement levels that serve as the reference for order price and stop loss
■ Displays a reverse Fibonacci retracement that serves as the reference for take profit
■ Indicates with arrows when Single Penetration is in progress
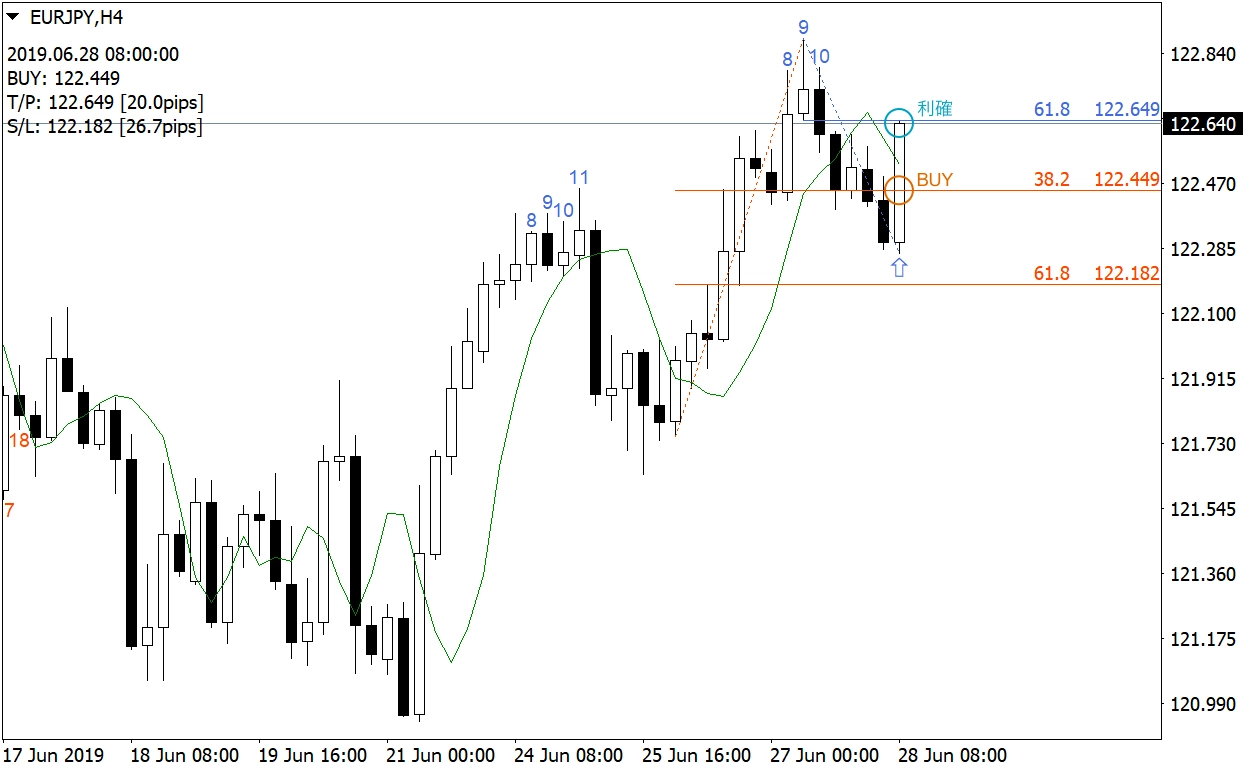
■ Displays the order price and take profit (T/P) and stop loss (S/L) (T/P and S/L can also be shown in pips)
■ Allows setting a margin for the price shown for S/L (displayable at prices a little away from 61.8%)
■ Plays a sound alert at entry timing
■ Displays an alert at entry timing
■ Push notifications to MT4 on smartphone at entry timing
■ Sends an email at entry timing
Even if you think it’s a great method, counting thrusts, drawing Fibonacci, and drawing the take-profit Fibonacci every time is a bit of a hassle.
Being able to do all of that automatically...
Users seem to use it in this way as well.
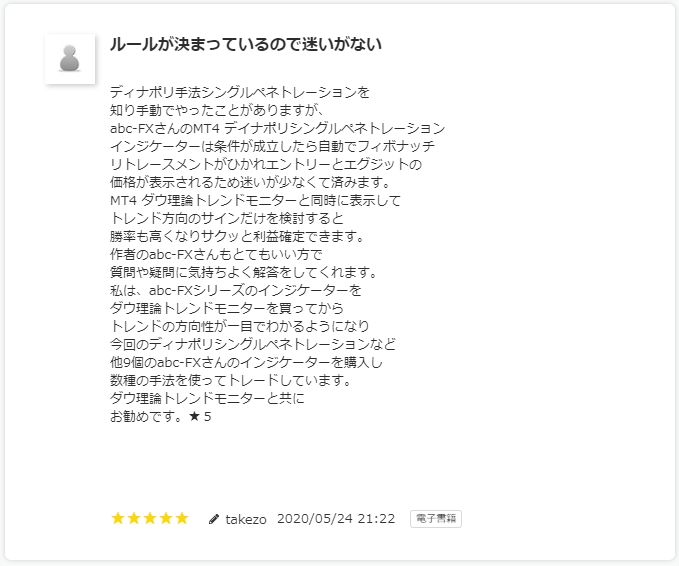
Use it in conjunction with the Dow Theory Monitor to fix your bias! A wonderful usage, indeed.
Something like this, perhaps?
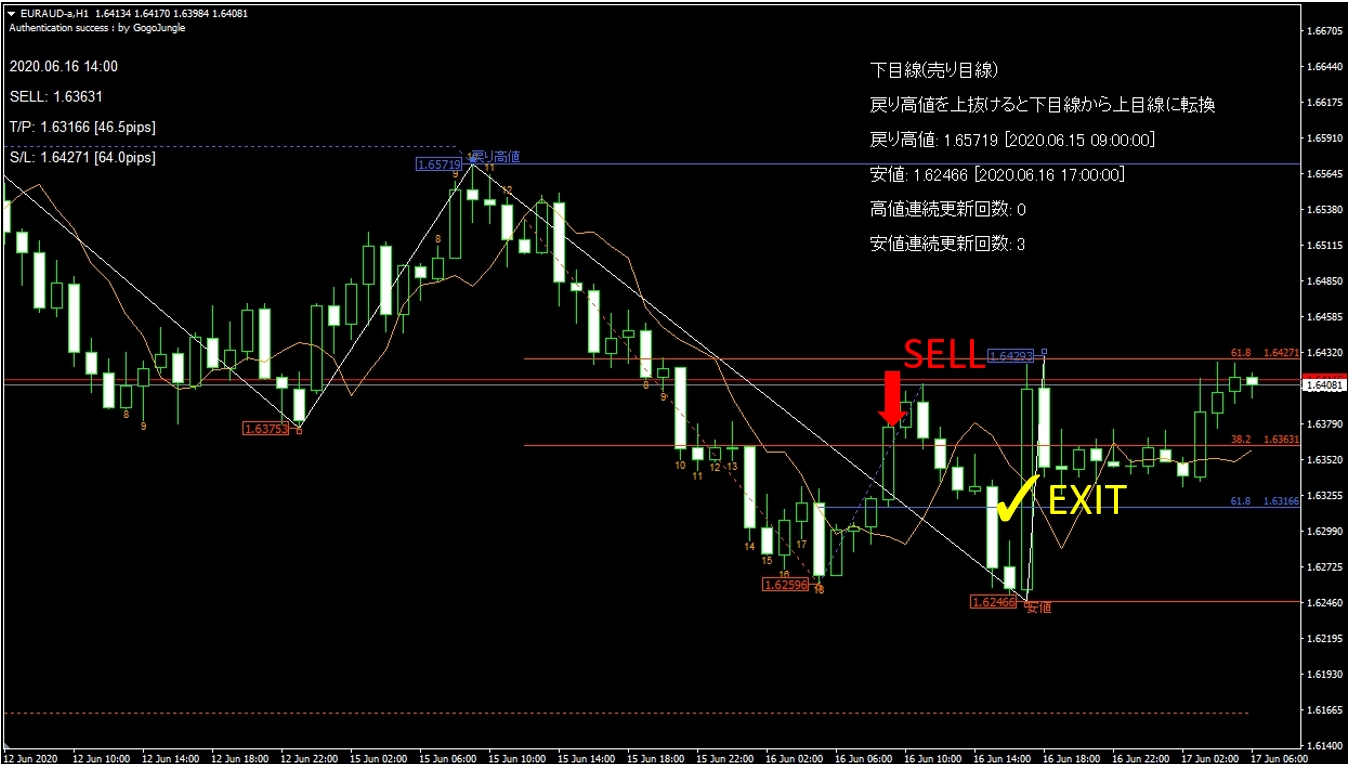
▲The Single Penetration method has ended, but the residual Fibonacci levels are still drawn.
According to the “Dow Theory Trend Monitor,” the bias is bearish, so entering with a short is correct. The chart shows textual comments, which is truly convenient for fixing your bias. I placed the display in the upper-right corner for a large view.
From the previous Single Penetration, you can see that because the bias was bearish, entering long would have hit the stop loss.
Let’s use the solid, proven method found by predecessors to reliably take profits!
MT4 DiNapoli Method “Single Penetration”


Written by Tera GogoJungle Marketing.