

Over 100% annual return with 3 positions, around 3000 pips per year 『KonokaSystem_USDJPY_M5』
We would like to feature "Konoka", which, although it has just started being offered, already shows signs of strong performance in the first month of forward testing.
I'm impressed by the potential glimpsed from backtests, so please keep an eye on this one going forward.
【Konoka Overview】
”KonokaSystem_USDJPY_M5 is a day-trading system targeting 00:00 AM to 13:00 PM Japan time.
The currency pair is USD/JPY, and trades are executed at the close of the M5. No grid or Martingale logic is used.
TP and SL are both set at 100 pips, slightly larger. This is to avoid losses from large-scale short positions.
There are also exit methods that use time and technical indicators.”
As explained, the SL is a bit wider, but in practice there are time-based and technical exits, so the average loss in pips is likely to be even lower.
The entry logic is not disclosed, so we will infer it from backtests.
Backtest Analysis
※Backtest data can be downloaded from the sales page. Analysis uses the official backtest data.
Backtest conditions:
Spread: 0.5 pips
Period: 2000/1/3~2020/6/4
Lot: 0.5 lot
It states that the entry is at the close, and backtests are performed at control points.
We ran a detailed analysis of the backtest data with Quant Analyzer.
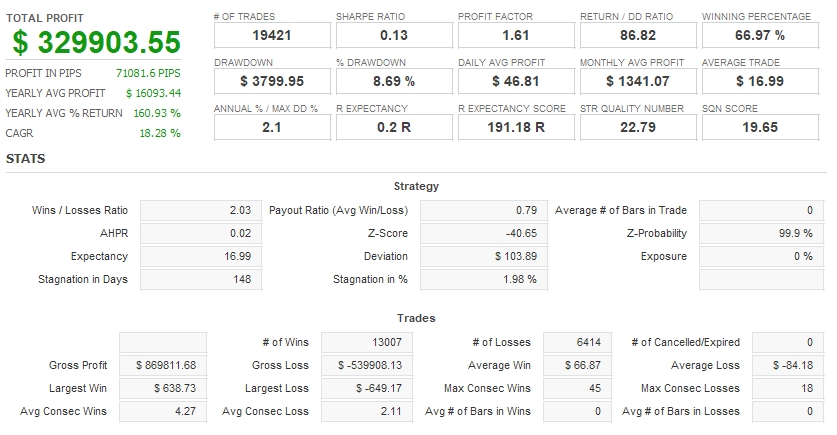
Annual average profit: $16,093 (about 3,200 pips)
Monthly average profit: $1,341 (268 pips)
Annual return: +160%
Win rate: 67%
Annual average number of trades: 947
Average profit per trade: $66 (0.5 lot, about 13 pips)
Average loss per trade: -$84 (0.5 lot, about -17 pips)
This is the result. The averages over nearly twenty years of backtesting are as above. With the high number of trades and even with 3 positions,Annual acquired Pips exceed 3000 pips! That's amazing.
Now let's look at the monthly and yearly detailed performance.
【Monthly Performance】
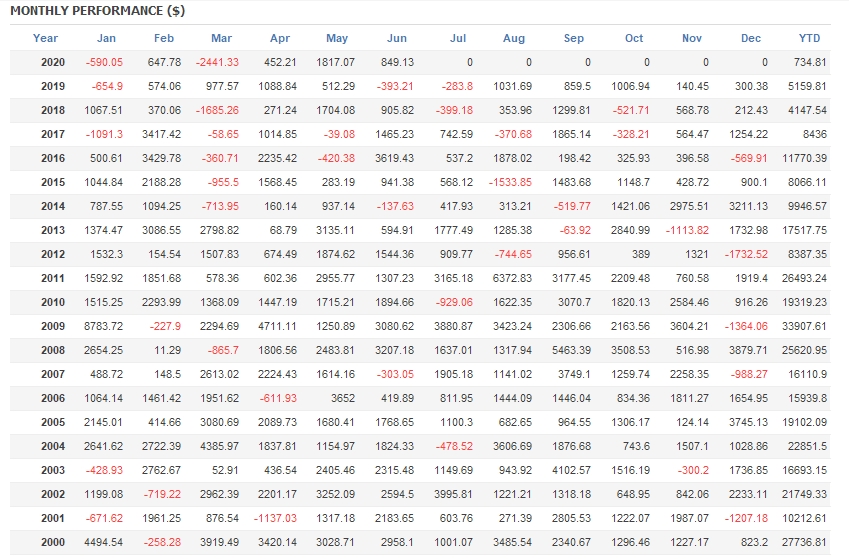
There are few months with losses on a monthly basis.
【Yearly Performance】
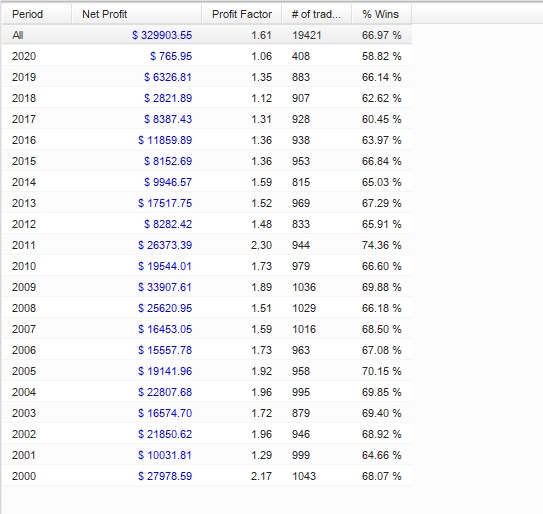
A high total number of trades and a stable win rate are evident. If the win rate falls below 60%, yearly profit would decrease.
We should pay attention to the forward win rate.
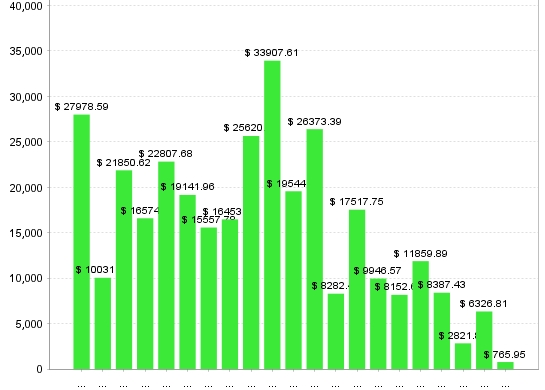
Looking at the graph, it looks like this. 2000, 2008, 2009, and 2011 stand out as particularly good years.
In the most recent 5–6 years, annual return has been modest, but it still yields annual profits of around $3,000 to $10,000, which is a solid profit.
【What kind of trades does it do?】
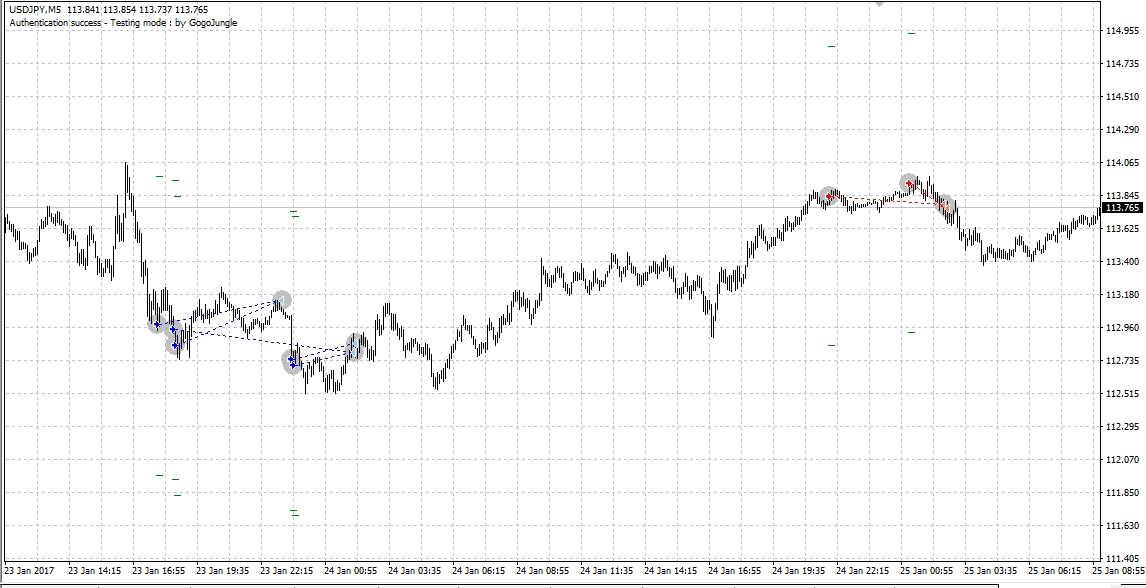
▲Blue: BUY Red: SELL
Buying at the bottom and selling at the top, so it may be a range-reversal type.
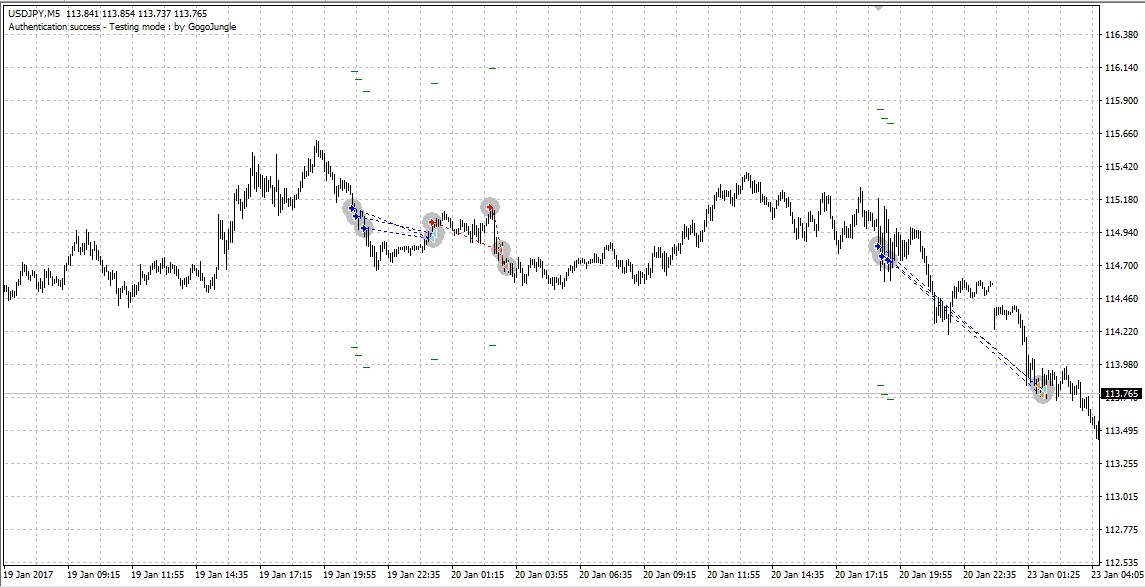
This is a case where it failed. It also looks like contrarian trading based on overbought/oversold signals like RSI.
In any case, it is not a trend-following type. However, considering that 2008-era performance was strong and recent years have been less favorable, the contrarian nature does not imply strength in low volatility; in fact, higher volatility periods seem to yield more trades and larger profits.
Also, the win rate is a little under 70%, so it might feel like frequent losses, but due to the high trading frequency and a risk-reward ratio of 1.63, it is a type of EA whose profits steadily accumulate with each trade.
【Recommended Margin and Returns?】
Since the backtest uses 0.5 lots, let's calculate the recommended margin for 0.5 lots.
(43,000 yen × 5)× 3 +(46 × 2)=1,600,000 yen
Annual average profit is about 1.7 million yen, soannual return exceeds 100%!
If operating with 0.1 lot, you can start from 320,000 yen (one-fifth of 0.5 lots).
Using the most recent five years as a reference would lower the average annual return somewhat, so please treat this as a rough guide.
With many trades and strong potential annual profits, KonokaSystem_USDJPY_M5 is worth watching!


2020.6.19 Updated
Written by Tera GogoJungle Marketing.


