
【FX Full-time Trader Cat's Pound-Yen Trade Analysis 0528】
This is the Pound/Yen on May 28th.
This is a trade following the basics of the Bollinger Bands cycle. In other words, I aimed for a back-and-forth move on the upward-sloping 4-hour middle band.
4-hour chart

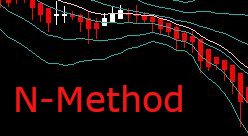
After this, according to the N-Method rules, the take-profit was about 35 pips. It’s modest, but it’s a steady win that can lead to a big win with the big win vs. small steady approach.
Looking at RSI, it is bouncing off the 50 line, which separates bullish and bearish conditions, twice.
Many people display Bollinger Bands, but not many truly use them faithfully. Return to fundamentals.
Daily chart

The middle band has become nearly horizontal. In this state, the probability of the price oscillating within +/- 2 standard deviations increases.
Weekly chart

Will it be drawn toward the middle band or will it try to fill the gap to -2 standard deviations?
Monthly chart

This also can be understood by considering scenarios based on the basic Bollinger Bands principles.
Now, let’s do our best for the last trade of May.