[USDJPY/EURUSD/GBPJPY] Market analysis for Wednesday, May 27, 2020
【USD/JPY/ EURUSD/ GBPJPY】Market Analysis for Wednesday, May 27, 2020
Good morning everyone! This is Yururi mo Yururi.
Thank you very much for visiting this blog.
On Wednesday, May 27, 2020I have updated the blog with market analysis.
Three currency pairs: USD/JPY, EUR/USD, GBP/JPYare covered.
Please take a look!
<<【USD/JPY/EURUSD/GBPY/JPY】Market Analysis for May 27, 2020】>>

<<<KOROPPOKURU - Automatic Horizontal Line Display>>>
<<<KOROPPOKURU - Triple Display of Moving Averages>>>
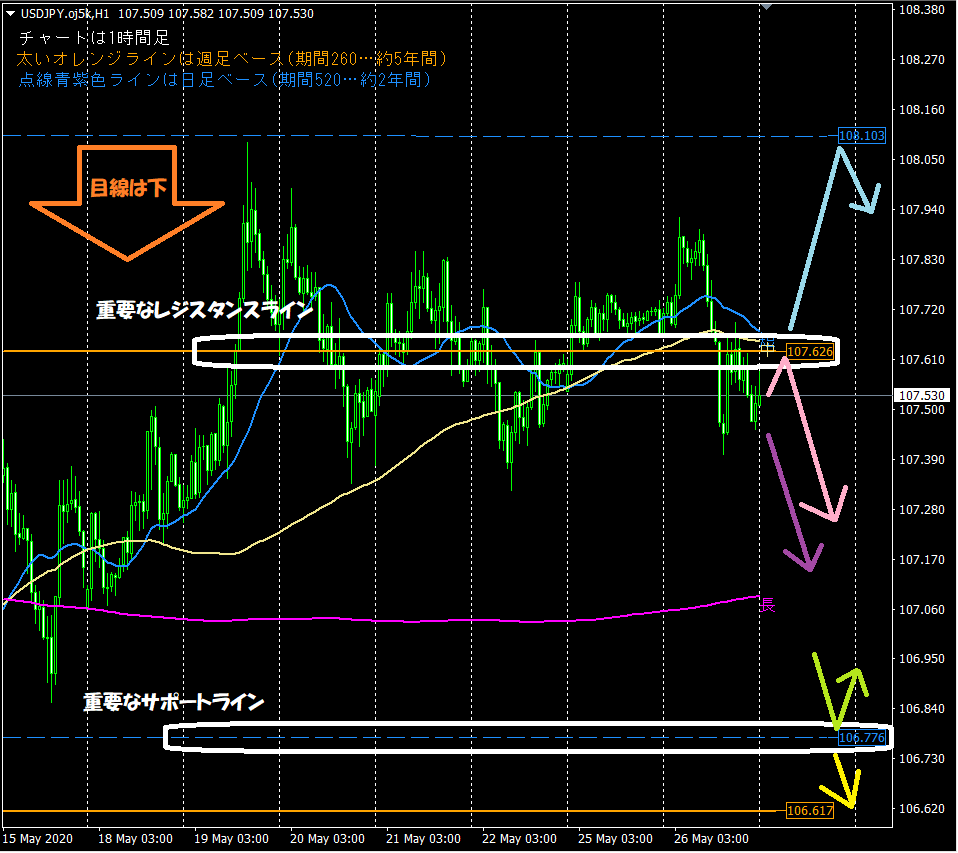
【Images used for USD/JPY chart analysis】
This week's market analysis is also posted on the blog. If you haven't seen it yet, please take a look.
<<【USD/JPY/EURUSD/GBPJPY】 Market Analysis for May 25–29, 2020>>
【Backtest of Koroppokuru Series Indicators】
This is a video of backtesting the indicators for the previous week (May 18–22, 2020).
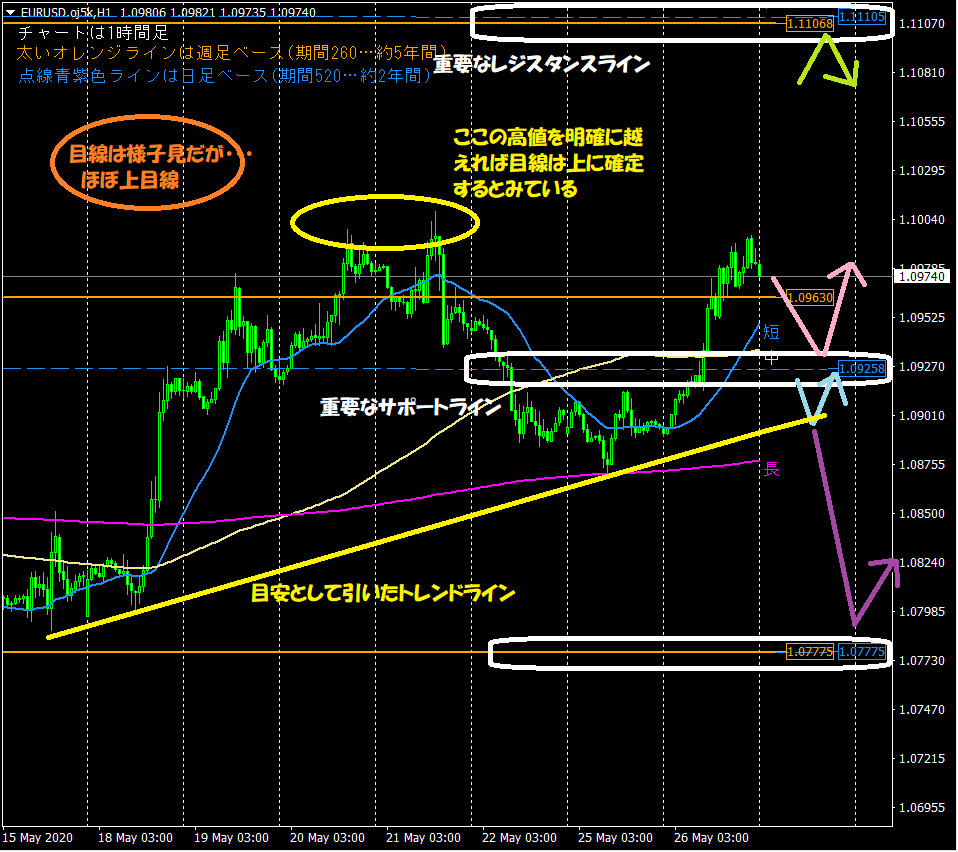
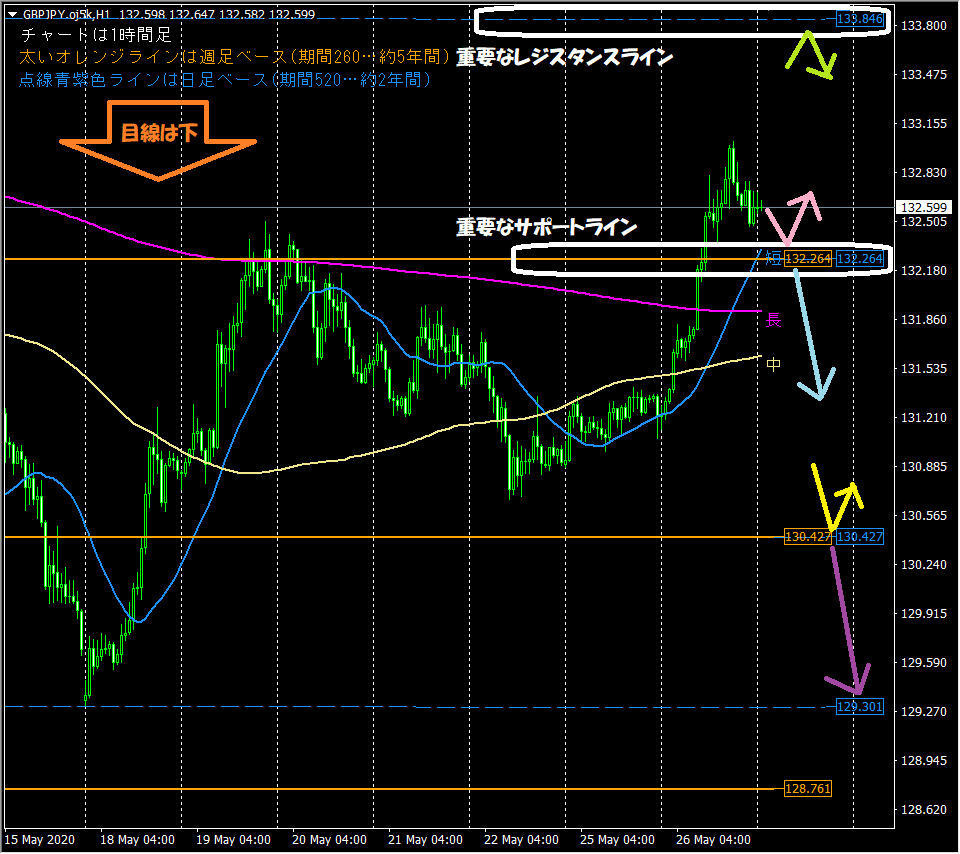
This is the hourly chart used in the blog's chart analysis every morning. Important points to look at are two things below.1) The horizontal lines automatically displayed by the indicators are functioning as support/resistance
⇒ Thick orange line (weekly base period 260… 5 years), purple dashed line (daily base period 520… 2 years)
2) Moving averages optimized for the hourly chart are often respected
⇒ Especially the short-term line (period 24… 1 day) and the long-term line (period 480… 1 month)
【Introduction to the On-Sale Product 'KOROPPOKURU - Automatic Horizontal Line Display'】
The indicators used in market analysis are designed to automatically display horizontal lines to reduce trading burden.
They analyze the highest and lowest prices within a set period by price band and automatically display up to three optimal horizontal lines across up to three timeframes..
Highly recommended for busy professionals and homemakers.
If you would like to purchase or are somewhat interested, please go to the product page from the link below!
<<<KOROPPOKURU - Automatic Horizontal Line Display>>>

【Introduction to the product 'KOROPPOKURU - Triple Display Moving Averages'】
The moving averages used in market analysis are shown with the newly released indicator "KOROPPOKURU - Triple Display Moving Averages"!
This indicator is intended for those who are wondering how to introduce and use moving averages.
Have you ever analyzed FX or stock and studied or traded, and considered introducing moving averages?
In such cases, you may have had the following concerns.
・Tried adding moving averages but cannot determine the best values for parameters, especially 'period'.
・Added too many moving averages and lost track of what is correct... want to reset the overuse!
・Some sites use 1 or 5 moving averages; which is correct?
・Tried implementing moving averages in my own way but not confident
This indicator solves all those concerns!
If you would like to purchase or are somewhat interested, please go to the product page from the link below!
<<<KOROPPOKURU - Triple Display Moving Averages>>>

【Introduction to the product 'KOROPPOKURU - Angle is Everything Series'】
An indicator that highlights MACD and OsMA angles as important signals.
Standard Version emphasizing reliability, Early Detection Version prioritizing speed are prepared.
Please take a look!
<<【All 4 Types Best Set】 KOROPPOKURU - Angle is Everything Series>>

We have公開 the indicator results from backtests.
We also公開 results for other currency pairs and timeframes, so please refer to them.
An indicator that highlights MACD and OsMA angles as important signals.
Standard Version emphasizing reliability, Early Detection Version prioritizing speed are prepared.
Please take a look!
<<【All 4 Types Best Set】 KOROPPOKURU - Angle is Everything Series>>
We have公開 the indicator results from backtests.
We also公開 results for other currency pairs and timeframes, so please refer to them.
We are also active on Twitter, so please follow us!
<<Yururi mo Yururi on Twitter>>

【Finally】
Thank you for reading this blog until the end!
I hope it will be a help for your asset management.