
【Bollinger Bands】
Since today is Sunday, I will talk about Bollinger Bands.
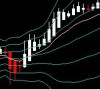
Next is the daily chart of the GBP/JPY Bollinger Bands.

There are some occurrences of expansion (bands widening up and down), but the middle band has a gently sloping downward angle.
In this kind of state, the currency value is likely to oscillate between the vicinity of the middle band and the lower band. More precisely, if you assume that such behavior forms this shape and that the state is likely to continue, you can achieve high-probability trades under that premise.
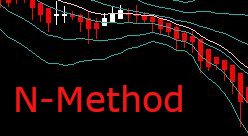
[If you work seriously, you will surely be rewarded] Here is the N-Method↓↓
× ![]()